Usage Reports
Go Up to AppWave Configuration and Administration
Contents
There are numerous reports that you can obtain through AppWave. These reports cover application and license usage for both Embarcadero XE Apps and 3rd party Apps.
Follow these steps to open a report:
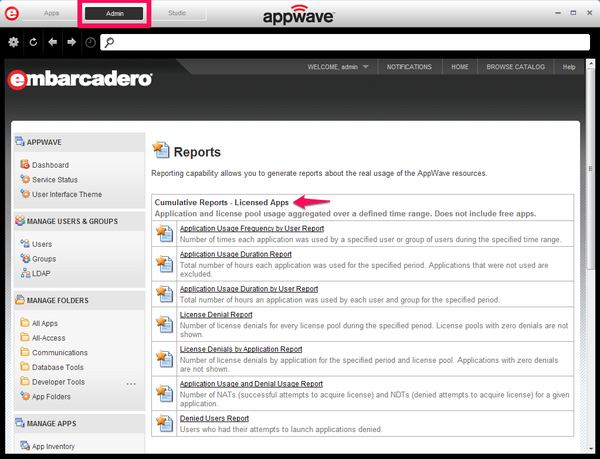
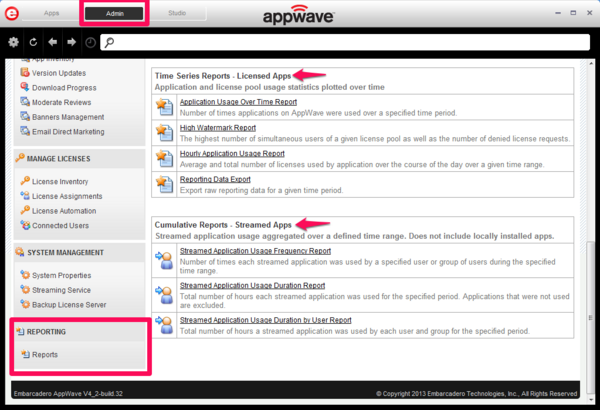
- From the REPORTING menu, select Reports. The Reports pane appears.
- Click the name of the report you want to generate.
- On the report page that appears, you can change many of the parameters such as the start and end date, time zone, users, and applications.
- Change the parameters of the report as required and then click View to generate the new report.
- Note: you can also export the raw data to a <.csv> file by clicking Export to CSV at the bottom of the page.
General notes about getting reports:
- Some reports display as graphs by default and can also be viewed in tabular format. Other reports are available in tabular format only.
- You can export all reports in CSV format for use in applications such as Microsoft Excel.
- You can also query the Embarcadero reporting database directly for information on license usage. To see more information go to: Querying the Reporting Database.
- AppWave does not monitor the use of locally installed apps such as those used offline.
Cumulative Reports for Licensed Apps
These reports do not apply for free apps. The following Cumulative Reports for Licensed Apps are available:
- Application Usage Frequency by User Report : Shows the number of times each application was used by a specified user or group of users during the specified time period. You can leave the User/Group field empty to list all the applications used at least once.
- Application Usage Duration Report : Shows the number of times each application was used by a specified user or group of users during the specified time period.
- Application Usage Duration by User Report : Shows the total number of hours each user or group was using AppWave services. Click the User/Group name to view which applications were used by that User/Group as shown in the Application Usage Duration by User Report.
- License Denial Report : Shows the number of license denials for every license pool for a specified period.
- License Denials by Application Report : Shows a number of license denials in a specific license pool for every application for a specified period and license period.
- Application Usage and Denial Usage Report : Shows number of successful and unsuccessful attempts to acquire a license for a given application.
- Denied Users Report : Shows the users who had their attempts to launch applications denied. The information in this report can help you decide when or if you should purchase additional licenses.
Time Series Reports for Licensed Apps
The following Time Series Reports for Licensed Apps are available.
- Application Usage Over Time Report : Shows application license checkouts over a specified time period.
- High Watermark Report : Shows highest simultaneous license usage count and number of denied licence requests.
- Hourly Application Usage Report : Shows the average and total number of licenses used per application on an hourly basis during a specific time period.
- Reporting Data Export : From this page, you can export all the reporting data for a given time period in a variety of different formats.
Cumulative Reports for Streamed Apps
The following Cumulative Reports for Streamed Apps are available.
- Streamed Application Usage Frequency Report : Shows the number of times each streamed application was used by a specified user or group of users during the specified time range.
- Streamed Application Usage Duration Report : Shows the total number of hours each streamed application was used for the specified period. Applications that were not used are excluded.
- Streamed Application Usage Duration by User Report : Shows the total number of hours a streamed application was used by each user and group for the specified period.
Reporting Data Export
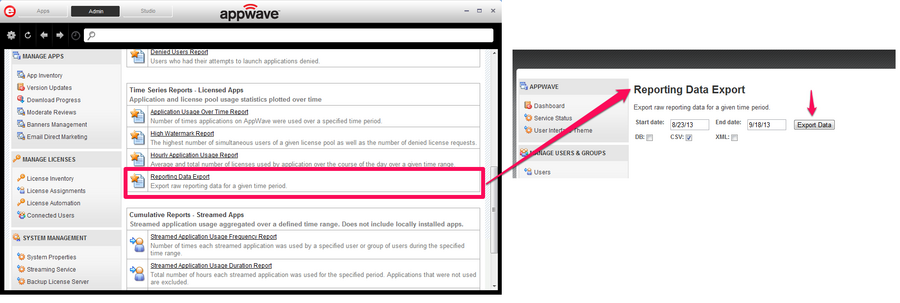
This specific report lets you export all raw reporting data over a specified time period. You can export the data in database, CSV or XML format.
- From the REPORTING menu, select Reports. The Reports pane appears.
- Click Reporting Data Export under Time Series Reports - Licensed Apps section.
- It opens a wizard to save a zip file. The date format is
mm/dd/yy
Querying the Reporting Database
There is a read-only user account that you can use to access the reporting database. You can use this account to query the database and access the raw data in the reporting database.
The reporting database is an Interbase database. You can query the database using SQL.
You can view the structure of the reporting database by using the IBConsole.exe program which is located in: C:\Program Files\Embarcadero\AppWave\X.X\InterBase\bin
Follow these steps to access the database:
- Launch IBConsole.exe .
- Expand Local Server > Databases.
- Right-click Databases and select Add and the Add Database and Connect dialog appears.
- In the Database > File area, click the browse button, and navigate to C:\Program Files\Embarcadero\AppWave\X.X\elc\db , select the
LM_REPORTING.IBdatabase and then click Open. - In the Login Information fields, enter the following:
- User Name: RPTUSER
- Password: awrpt1
- In the InterBase Servers tree, click the Lm_reporting database to view the structure.
Backup the Reporting Database
In order to backup reports, make a backup of your report database. This is where AppWave saves the report data.
Report database: LM_reporting.ib is located in: C:\Program Files\Embarcadero\AppWave\XX.X\elc\db\ .
To restore the reports follow the steps:
- Stop the AppWave service.
- Replace the old database with the backed up one.
- Start AppWave.


