Monitoring Sessions
Go Up to Session 8: Performance Management
While this example is specific to Oracle the Process Monitor is available for all of the supported platforms.
To start the DBArtisan Process Monitor:
- On the Datasource Explorer, select any Oracle datasource.
- From the Utilities menu, select Database Monitor.
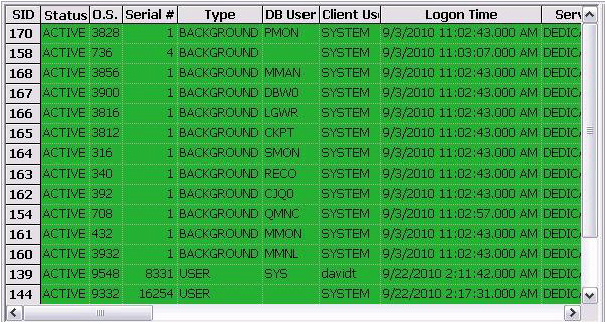
- The Database Monitor includes the following options and features:
- Highlight any session and any currently running SQL is displayed in the lower pane.
- You can drill-down into a specific session to display session-level statistical details, historical and current wait events along with a working copy of the currently running SQL that can be copied to an ISQL for Explain Plan generation.
- By using the Monitor dropdown options you can display more advanced database-level monitoring data such as locks, blocking locks, hit ratio by user, Top 20 SQL, etc.
- Close the Database Monitor pane.


Proceed to Advanced Client-Side Performance Monitoring.