Analyzing Results
Analyzing Results
Query 1
- The following query ran for more than a day before I killed it : SQL Query Text Q1
- I ran it through Quest's SQL Tuner to see if I could find a better plan, but the basic cases too so long I could get very far.
- Then I tried to analyze it with DB Optimizers VST diagrams.
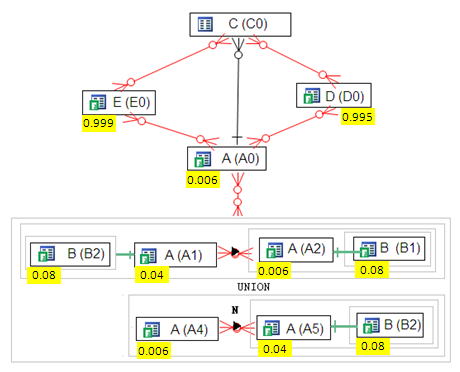
- Laying it out in a Visual SQL Tuning (VST) diagram gives:
- Immediately we can notice some unusual things about the query such as table A is used 5 times and table B is used 3 times, but I analyzed this query without know what, why or how the had made it. The diagram in it's default state has a fair bit going on, but we can eliminate a lot. For starters we can eliminate all the
- Type joins. In these cases, the table B has a subquery on it (denoted by the gray box around it) and only one row is being selected. In this case the select on B acts as a filter on A, so we can just eliminated it from the diagram as it won't change the actual execution plan because it can't be merged and it has to be run before we can select on A. Thus let's eliminate all the selects on B of this type giving us:
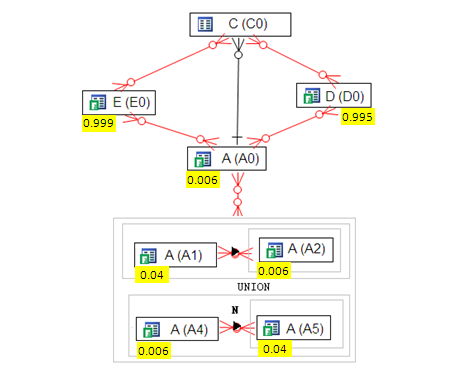
- Now we can go farther simplifying the query because UNION has to be executed before joining into the rest of the query. Oracle, as of now, AFIK, has no way of merging a UNION inot the main query (I ran this by Benoit at Oracle who confirmed)
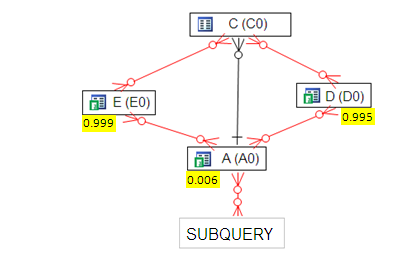
- But the UNION doesn't have that much interesting going on. We have an outer join between A1 and A2 and a NOT EXISTS between A4 and A5. We can vary how we do these joins, but the big question of join Order is mute because there are only two tables. Thus we can farther simplify the query as:
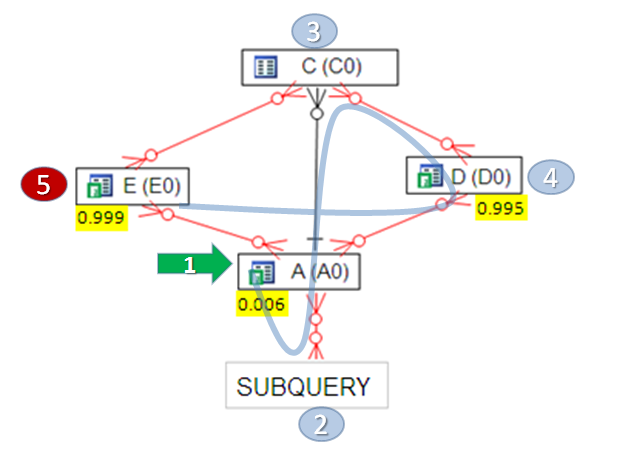
- Now the question is where to start the join. It's pretty clear that we start at A (A0) because it has the most selective filter returning only 0.006 of the table. We can then join to C (C0) to play it safe. To know where to go from here we have to have more information, but with this starting point we have made the most important decision in the execution plan.
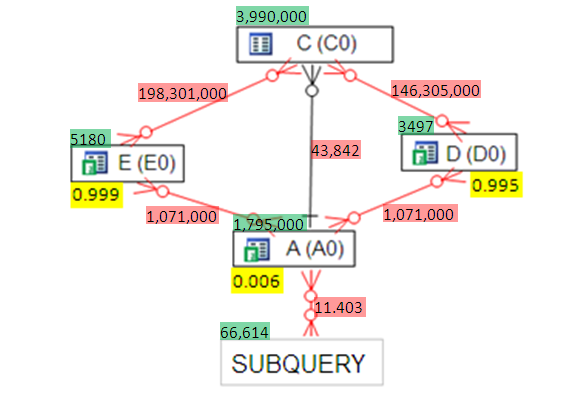
- Going farther in our analysis, lets look at TWO TABLE JOIN sizes
- Light green is the table sizes which aren't need for the analysis but are interesting for discussion.
- Light red is the TWO TABLE JOIN (TTJ) sizes.
- From the TTJ sizes we can see it's a horrible idea to join (E,C) or (D,C) at the start of the query.
- On the other hand the best join is (A,SUBQUERY) the to C.
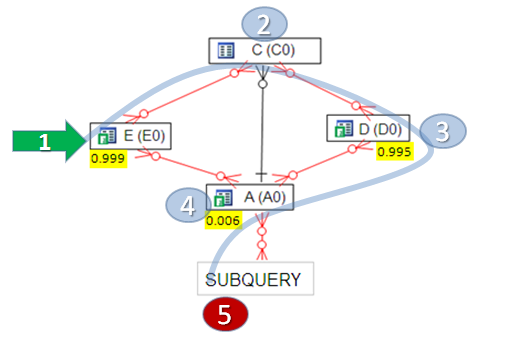
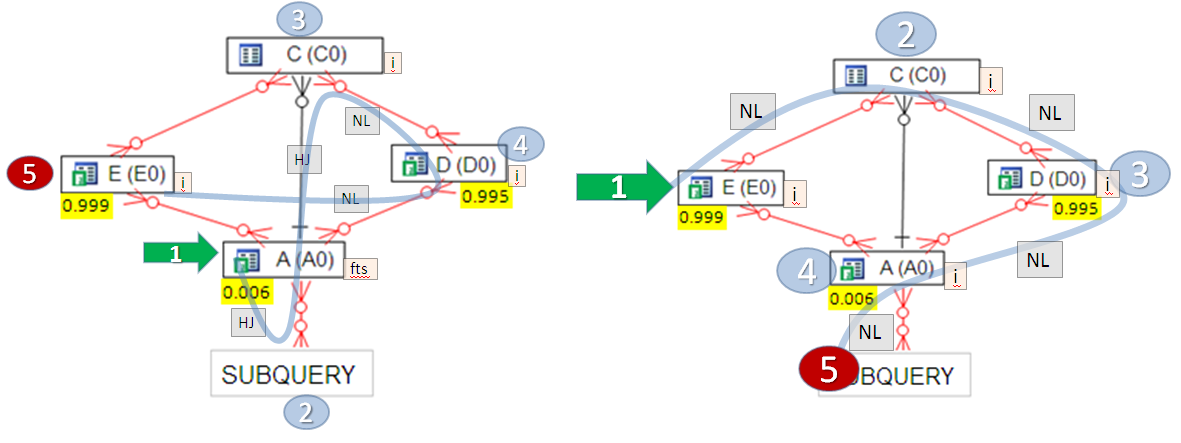
- We end up with a JOIN PATH like:
- Oracle's default path was
- Which is clearly wrong because it starts with the worst join possible.
- Oracle's default path took over a day, where as the new path took 30 seconds.
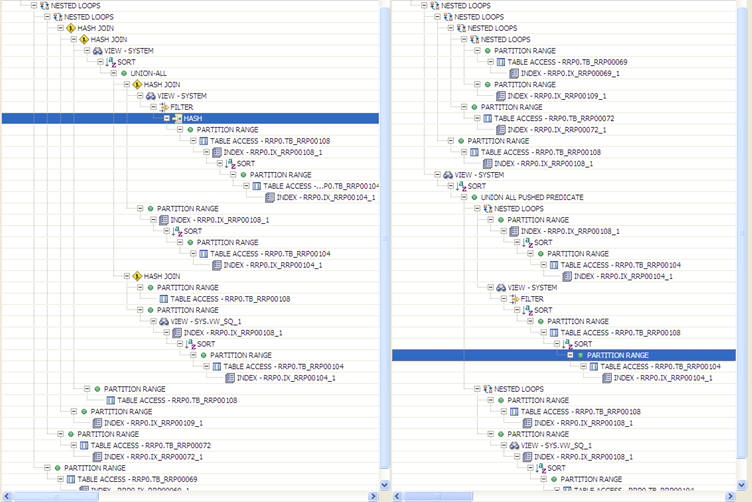
- We can compare the plans side by size which even at the small size above enables the viewer to see some big differences.
- where as the text comparison is quite difficult and tedious.
Query 2
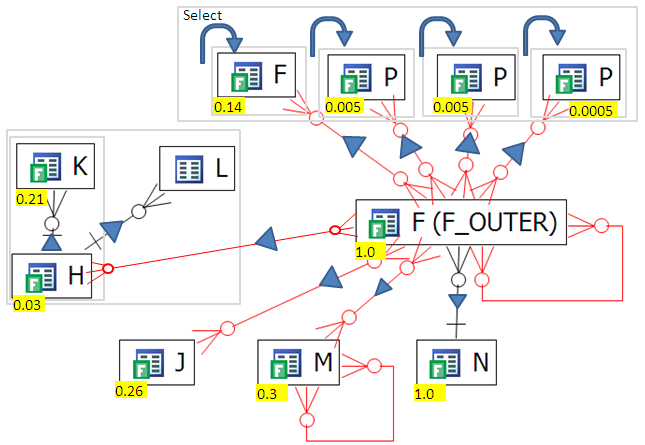
- The VST diagram looks like
- There are two interesting things about this diagram.
- Every thing is OUTER JOINED to F_OUTER
- There are correlated subqueries in the select
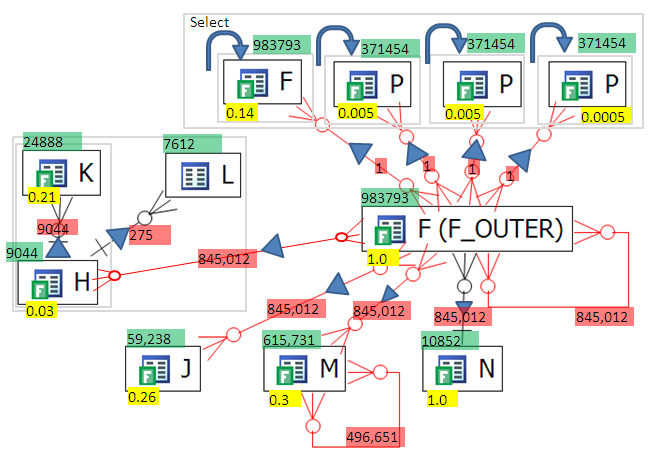
- There are two things to check - what is the effect of the OUTER JOINS. The OUTER JOINS can easily mean that all joins into F_OUTER don't change the result set size. Let's confirm by looking at the TTJ sizes:
- The only thing that bounds the number of rows returned by F_OUTER is it's self join (the line going in and out of F_OUTER) on the bottom left of F_OUTER.
- What this means is that it doesn't matter what order we join tables into F_OUTER.
- Now we can turn to the other interesting thing about the query. There are 4 correlated subselects in the select clause. These queries in the select clause are called "scalar subqueries." These scalar subqueries can be a bad idea or a good idea depending on how mainly on how many distinct values are used as input into the them.
AFAIK, Oracle doesn't merge subqueries in the select, and certainly not the ones in this query because they are embedded in cases statements - looks like I might have spoken too soon! more research to do but looks like Oracle can merge these scalar subqueries even with the case statement. I will try to run some more tests . To be continued)
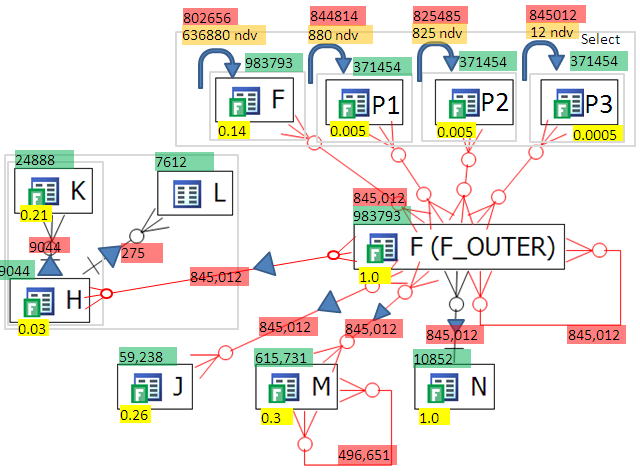
- In the worst case scenario the scalar subqueries are going to be run 845,012 times - that is one heck of a lot of work which would be a BAD IDEA.
Looking at the above diagram, and the 4 scalar subqueries in the select clause, the top red number is how many times the scalar subquery will be run (based on the case statement in the select clause) and the orange highlight is how many distinct values will be used in the scalar subquery where clause. P3 will benefit for scalar subquery caching but F won't because there are too many distinct values. On the other hand for P1 and P2 could if there are no collisions (see CBOF p216-217) and the scalar subquery caching is actually supports 1024 values. ( see http://www.oratechinfo.co.uk/scalar_subqueries.html#scalar3 ) for a great write up on analysis of scalar subquery caching - the analysis on this page seems to show that caching maxes out way before 1024 but that might be because of collisions)
The subqueries in the select clause look like
- select CASE WHEN F.f1 IS NULL
- THEN NULL
- ELSE (SELECT X.f2
- FROM X
- WHERE code_vl = F.f2)
- END AS f0
- from F;
and could be merged into the query like:
- select CASE WHEN F.f1 IS NULL
- THEN NULL
- ELSE ( X.f2)
- END AS f0
- from F , X
- where code_vl(+) = F.f1;
( NOTE: the first query will break if the correlated sub query returns more than one value where as the second query will return the multiple rows.)
The VST diagram can't tell you that this is the solution, but they can point out that the place to spend your time is the subqueries in the select.
Query 3
- see text at : [Query 3]
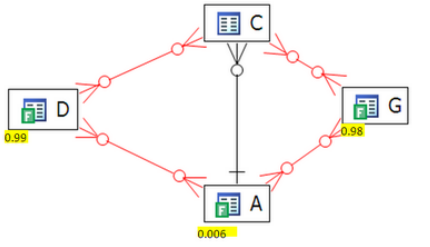
- This is a simple query compared to Query 1 and Query 2. The diagram looks like
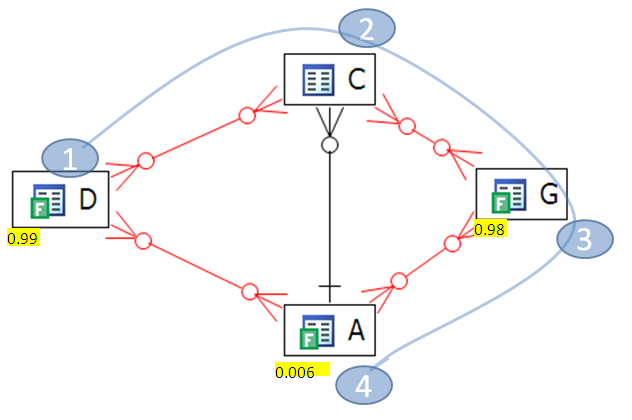
- By default Oracle chooses this path:
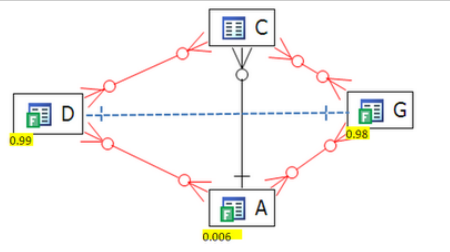
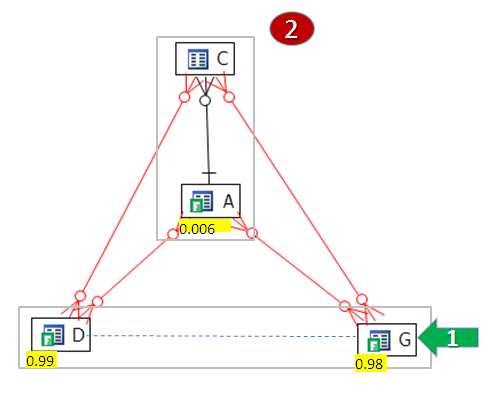
- As we can clearly see, this is the wrong path. Why? Because, as previously blogged about, Oracle starts the join on table D who has a non-selective filter returning 0.99 of the table. A more optimized path would be
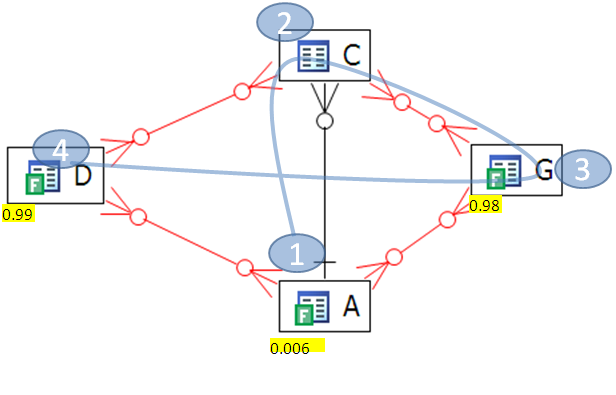
- We start at the table with the most restrictive filter, table A, whose filter returns 0.006 of the table. This path is much better than the first path.
- 1. First Path 4.5 secs, 1M logical reads
- 2. Second path 1.8 secs 0.2M Logical reads
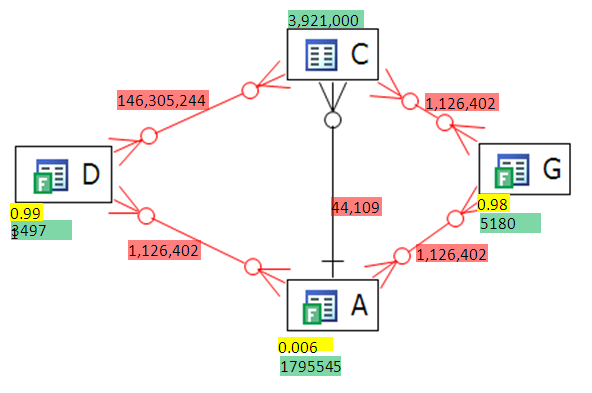
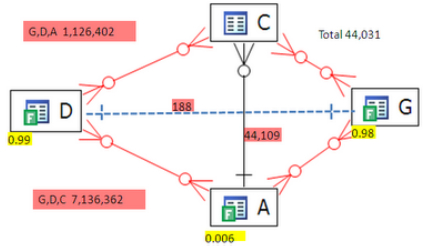
- Let's look at the extended VST stats on the diagram to confirm our ideas:
- Green is Table size
- Yellow is Filter Ratio
- Red is the Two Table Join Size
- It's clear that the first join should be (A,C) because it give us the smallest running row count at the beginning of the execution path. (yellow is filter ratio, green is rows in table and red is the resulting join set size between tables including using the filters)
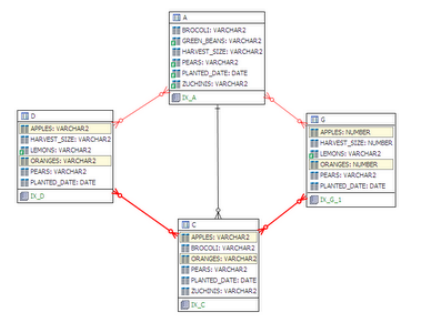
- Now let's look at the query more closely. There is actually a connection from G to D that we can get through transitivity. Here we can see the transitivity (the yellow highlighted fields are the same in D, G and C).
- D.apples=C.Apples and C.Apples=G.Apples
- same can be said for oranges, so our VST diagram actually looks like:
- The transitivity brings to light a lurking ONE-to-ONE relationship between D and G! Thus a join between D and G will return at most min (D,G) rows and maybe less. Let's see what the row counts are:
- Check it out! the join set between G and D is only 188 rows!!
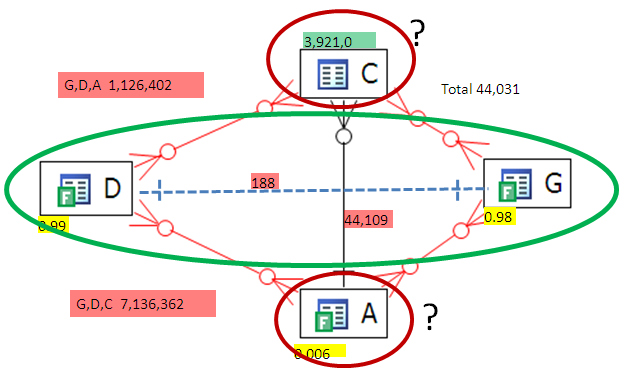
- But if we join G to D, then where do we go? Remember Oracle can only join to one other object, either C or A. Looking at the join set sizes (G,D)C is 7M ! and (G,D)A is 1M !
- A big result sets where as the result form A to C is only 44K. How can we take advantage of the low result set from (G to D) and (A to C) at the same time? The answer is to make subqueries that force Oracle to evaluate them separately and then join the results sets:
- SELECT * FROM
- (
- SELECT /*+ NO_MERGE */ c.apples, c.oranges, a.harvest_size
- FROM a, c
- WHERE
- a.planted_date = TO_DATE ('02/10/2008', 'dd/mm/yyyy') AND
- .pears = 'D' AND a.green_beans = '1' AND
- a.planted_date = c.planted_date AND
- a.pears = c.pears AND
- a.zuchinis = c.zuchinis AND
- a.brocoli = c.brocoli AND
- a.zuchinis = '0236'
- ) X,
- (
- SELECT /*+ NO_MERGE */ d.apples, d.oranges, d.harvest_size
- FROM d, g
- WHERE
- d.planted_date = TO_DATE ('02/10/2008', 'dd/mm/yyyy') AND
- g.planted_date = TO_DATE ('02/10/2008', 'dd/mm/yyyy') AND
- g.apples = d.apples
- AND d.oranges = g.oranges
- AND d.pears = 'D' AND g.pears = 'D'
- AND g.pears = d.pears
- AND g.harvest_size = d.harvest_size
- AND (d.lemons = 0 OR d.lemons IS NULL) AND
- (g.lemons = 0 OR g.lemons IS NULL)
- )
- Y WHERE
- X.oranges = Y.oranges AND
- X.apples = Y.apples AND
- X.harvest_size = Y.harvest_size;
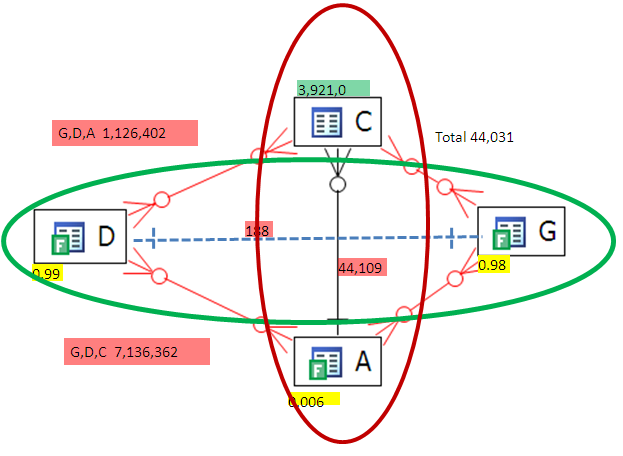
- The VST looks like
- It doesn't really matter where we start. We join (G,D) and separately we join (C,A) then we join these two result sets.\
- This final version runs in
- elapsed 0.33 secs and 12K logical reads
- down from an original
- elapsed 4.5 secs and 1M logical reads
- Tuning this query manually by an average developer or DBA would take hours., an expert could maybe do it in less than an hour, and a junior analyst might not be able to tune it at all. On the other hand the query can be tuned in minutes with VST diagrams which include join filters, 2 table result set sizes and analysis of transitivity.
- The VST relies filter ratios and 2 table join result set sizes works well. For queries where even the 2 table results take too long, such as a multi-day data warehouse query there are other ways to estimate the join result set and filter ratios. We will explore some of these methods in future posts.
Query 4
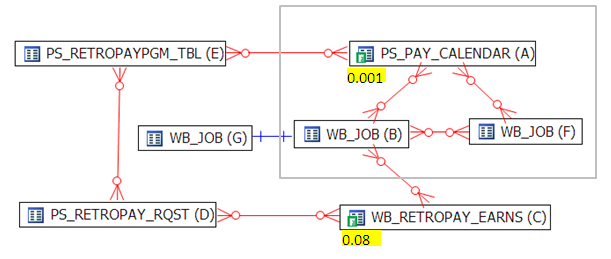
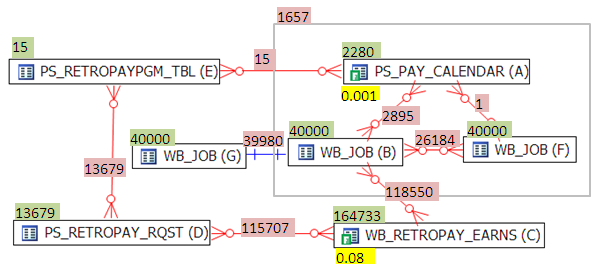
- With this diagram we have a good idea of the join path. Start at A which has the most selective filter then join to C by the shortest path with is B. This join path (A,B,C) lays the foundation for a good join path.
- The actual best path is A,F,B,G, C, D, E but to know that we we need more information which is the TTJ sizes.
- It's helpful to know the query returns about 2000 rows (which are summed and grouped by to output one row) so we should be able to prune the "running row count" down and keep it down.
- Start at A (highest filter ratio)
- Join to F (only 1 row, doesn't change running row set size )
- Join to B (got to go to B to get to C )
- Join to G (minor filtering)
- Join to C (next best filter ratio)
- Join in D and E at the end, looks like they are translation joins
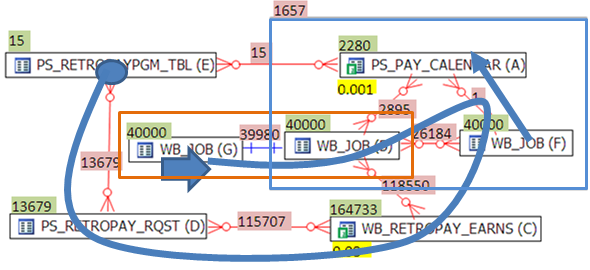
- For some reason ( I think it's a bug ), Oracle joins A to F before applying the filter on A and makes a view that it then uses to join to B. The problem is this view on A to B is expensive before the filter on A is applied because it means a join of 2280 to 40,000 rows, whereas after applying the filter to A, we have only 1 row to join into F returning 1 row.
- Default plan
- Optimized plan
