Profiler
Contents
Profile
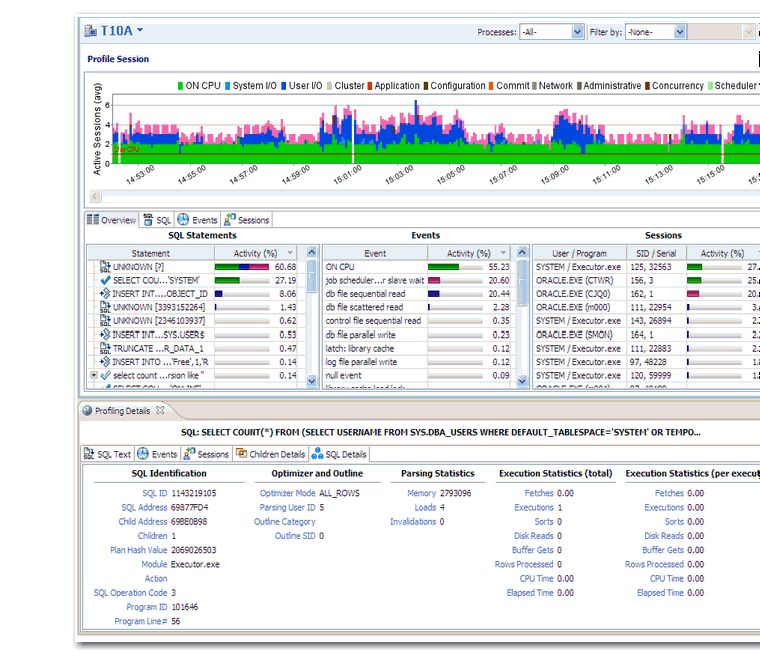
Profiling filters out well performing light weight SQL and collects information on heavy weight SQL. SQL that is heavy weight are either long running queries or queries that are short but run so often that they put load on the database
Profiler takes snapshots of user/session activity once a second and builds up a statistical model of the load on the database. The sampled data displayed in 3 ways
- 1. Load on the database measured in average number of sessions active
- 2. Top Activity - top SQL, Event and Session
- 3. Details - detail on a SQL , Session or Event
The idea is to look at the load on the database, the top graph on the screen. The graph on the top of the screen the shows the load on the database and can quickly indicate how the database is functioning. The database could be
- 1. idle
- 2. light load
- 3. heavy load
- 4. Bottlenecked
Problems can come from 4 areas
- 1. Machine cpu, slow disks (network)
- 2. App – locks, invalid SQL
- 3. Database – cache sizes, log files, etc
- 4. SQL
Reference: Wait Events Defined
Advanced: Accessing DB Optimizer's Raw Data via SQL or Excel
DB Optimizer 2.0 features
Profiling SQL tab enhancements
| Platform | Average SQL exec time | Show procedure content | Show executed line in procedure |
| Oracle | yes | (planned 3.0) | (planned 3.0 for 10.2.0.3 and higher ) |
| Sybase | (planned 3.0) | (planned 2.5) | (planned 2.5) |
| DB2 | yes | (planned 2.5) | (planned 2.5) |
| SQL Server | (planned 2.5) | (planned 2.5) | (planned 2.5) |
Oracle profiling already distinguishes between the calling procedure and sql executed by the procedure. These values are displayed as different rows in TOP SQL. By contrast, SQL Server, Sybase and DB2 only report the procedure in TOP SQL thus the priority of adding procedure content and line number in 2.5 for these platforms and delaying the improvements on Oracle till 3.0 since Oracle's functionality is already sufficient for proper performance analysis.
Editor Detail Drilldown
For statements
| Platform | SQL Text | SQL Details | Events | Sessions | Children Details | Object I/0 |
| Oracle | yes | yes | yes | yes | yes | yes |
| Sybase | yes | (planned 2.5) | yes | yes | ||
| DB2 | yes | yes | yes | yes | ||
| SQL Server | yes | (planned 2.5) | yes | yes |
For events:
| Platform | SQL | Sessions | Raw Data | Analysis |
| Oracle | yes | yes | yes | Only for “buffer busy waits” “cache buffer chains latch” |
| Sybase | yes | yes | ||
| DB2 | yes | yes | ||
| SQL Server | yes | yes |
For Session:
| Platform | Session Details | SQL | Events |
| Oracle | yes | yes | yes |
| Sybase | yes | yes | yes |
| DB2 | (planned 3.0) | yes | yes |
| SQL Server | yes | yes | yes |
