Code Insight Reference
Go Up to The Code Editor Index (IDE Tutorial)
Contents
- 1 Code Insight using Delphi Language Server Protocol (LSP)
- 2 Code Completion — Ctrl+Space
- 3 Parameter Completion — Ctrl+Shift+Space
- 4 Code Hints
- 5 Tooltip Expression Evaluation
- 6 Tooltip Insight
- 7 Find Declaration — Ctrl+Click
- 8 Block Completion — Enter key
- 9 Class Completion — Ctrl+Shift+C
- 10 Error Insight
- 11 Index for C++ Insights
- 12 Advanced Options
- 13 Next
Code Insight refers to a subset of features embedded in the Code Editor, such as:
- Code Completion
- Parameter Completion
- Code Hints
- Tooltip Expression
- Tooltip Insight
- Go To Definition
- Block Completion
- Class Completion
- Error Insight
These features help speed up editing your code and assist you in the selection of properties and methods, or provide information about symbols. The features above are described in more detail in the following subsections.
To enable and configure Code Insight features, choose Tools > Options > Editor > Language and click on Code Insight Options option.
Code Insight features are now defined per Language.
Delphi uses the Language Server Protocol (LSP) for Code Insight.
For C++, the IDE automatically uses Visual Assist or Classic Code Insight providers depending on the compiler being used (Clang or Classic). The C++ LSP server is available for Clang but turned off by default.Code Insight using Delphi Language Server Protocol (LSP)
The Language Server Protocol (LSP) is a specification that provides language services through a separate server process that communicates with an IDE. As a result, Code Insight features are provided by a separate process(es), and the features are asynchronously provided.
The Project View has a small pane at the bottom displaying the LSP server activity. It helps the communication when parsing.
Languages
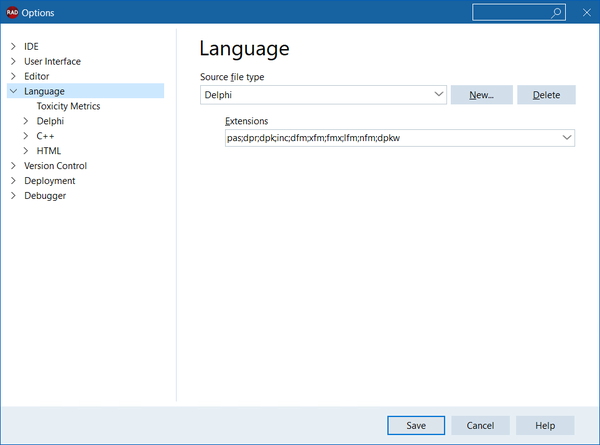
Languages are defined in Tools > Options > Language setting pane, where you can see a list of all languages available. You can also create a new language.
Editor Options and Syntax Highlighting
The Editor options and Syntax Highlighting are defined per language. You can find them in Tools > Options > Editor > Language.
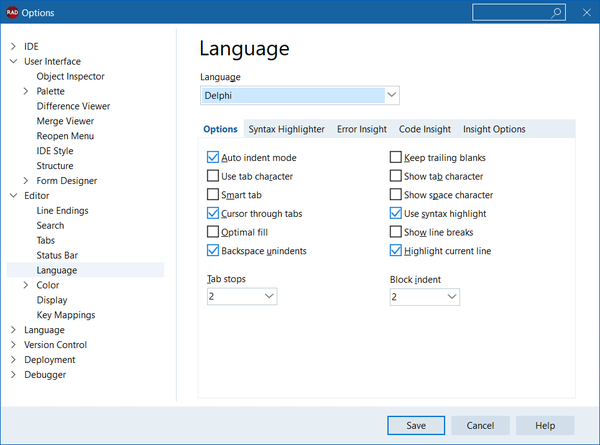
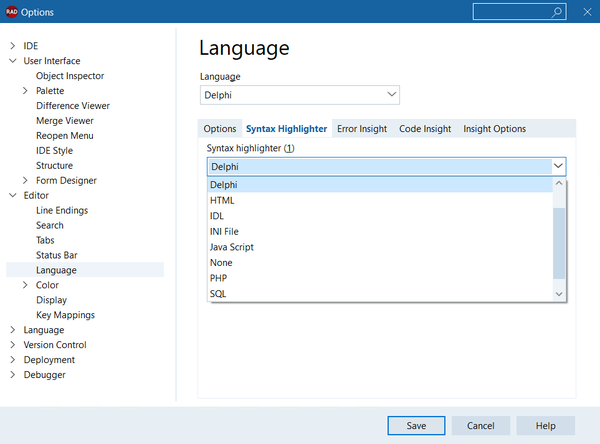
On this setting pane, you can choose a language. There are specific editor options, as well as the Syntax Highlighter language options.
Changing Code Insight / LSP Manager
Delphi LSP is enabled by default. You can check if the IDE is using Delphi LSP by
- When opening your Delphi project or making significant changes, you should see a small progress bar at the bottom of the Projects view showing DelphiLSP activity.
- Alternatively, open Task Manager and look for a DelphiLSP.exe process. You will typically see multiple processes.
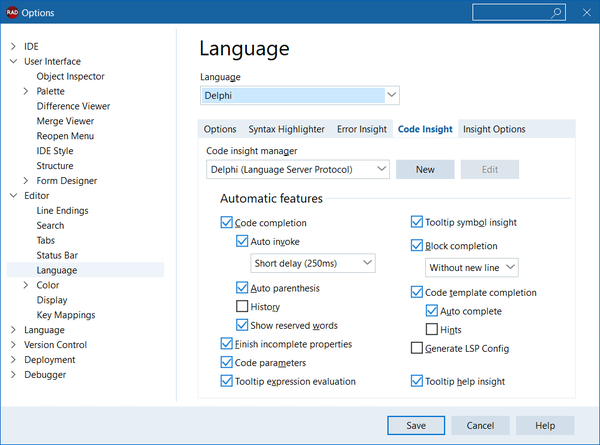
The final tab for a language is Code Insight. It provides the User Editor Font and a set of Code Insight settings.
The Code Insight Manager provides Code Insight functionality for a language. You can set this to any manager listed there, even if that manager was not intended for the language.
To change Delphi between using LSP and the Classic Code Insight implementation, choose:
- Delphi (Language Server Protocol): the new LSP support.
- Delphi (Classic Code Insight): the old implementation of Code Insight used in 10.3.3 and earlier. When you select this option, you turn the LSP off.
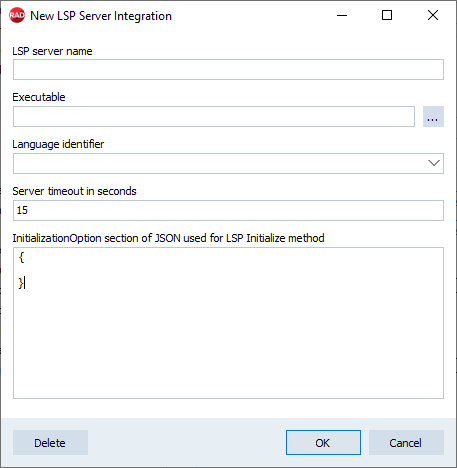
You can also create a New LSP Manager. Click on New, and a dialog appears allowing you to specify the LSP server executable and some options, including a friendly name, the language identifier, a timeout after which the server will be forcibly restarted, and any server-specific initialization options to be injected into the Initialize JSON RPC call.
You can use this option to add a server for Python or any other language.
Creating .delphilsp.json Files
The project-specific configuration for using LSP is automatically saved to a .delphilsp.json file with the same name as the project. This config file is read when using LSP with an external editor such as Visual Studio Code. To turn on generating this file:
- Create a Delphi project.
- Go to Tools > Options > Editor > Language > Code Insight and turn on Generate LSP Config.
- Save and close your project in the IDE.
- When reopening your project, a new project appears with the same name and a different extension (.delphilsp.json).
Code Completion — Ctrl+Space
The Code Completion feature displays a drop-down list of all items and methods that contain the typed string anywhere in an identifier. It shows set types. When declaring a property, it also suggests getters and setters.
You can code complete header files that are not directly part of the project and the project's main source.
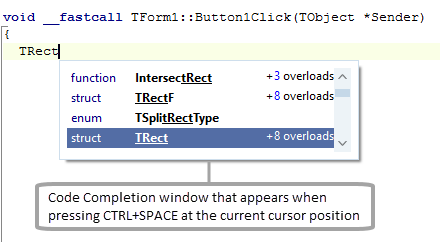
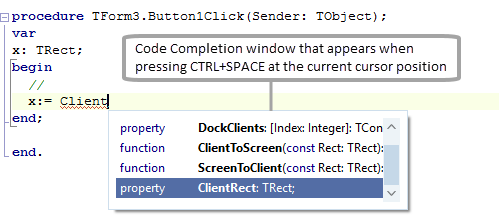
To invoke Code Completion, press Ctrl+Space while using the Code Editor. Select the character and press Enter to insert the text in the code at the cursor location.
Code Completion is also automatically invoked at some code locations, such as when you type a period "." in Delphi, or a period ".", arrow "->", scope "::" or header "#include <" statement in C++.
You invoke Code Completion for your specific language in the following ways:
C++
- Press
Ctrl+Space(always invokes Code Completion). - Enter
.or->(only works when Auto Invoke is enabled on the Code Insight Options page). - To cancel a Code Completion request, press the
Esckey.
- Press
Delphi
- Press
Ctrl+Space(always invokes Code Completion). - Enter
.(only works when Auto Invoke is enabled on the Code Insight Options page). - To cancel a Code Completion request, press the
Esckey.
- Press
When you type characters, the selection/match behavior as you type considers the following situations:
- When there is an exact match between what is typed and an identifier, it is selected.
- Otherwise, the first identifier that starts with what was typed is selected.
- Otherwise, the first identifier that contains what was typed is selected.
For example, when you type MyControl in the editor, invoke code completion, and then when you type rect, not only the properties or methods beginning with Rect are shown, but also ClientRect, BoundsRect, etc. Anything containing rect inside the identifier string is shown.
Code Completion works correctly, including correct results, in situations including:
- A new file that does not yet exist on disk.
- A new project where neither the project nor any units exist on disk.
- A modified unit, not yet saved, where the current in-IDE code has changes that affect completion results.
- Results are correct (and changed correctly) when changing target platforms or other project options.
- When a unit includes a .inc file.
Code Completion in Uses Clause Completion:
- Shows PAS files and DCUs in the project and search paths.
- Lists units from the search path and their shortened versions without the configured namespaces.
- Indicates when the selected unit is already used in the current unit.
- Matching and filtering are case-insensitive.
- Code Completion will work when Use MSBuild externally to compile is turned ON.
- The Code Completion dropdown:
- Selects the shortest matching symbol.
- Selects the top item when it is first displayed.
Code Completion Settings
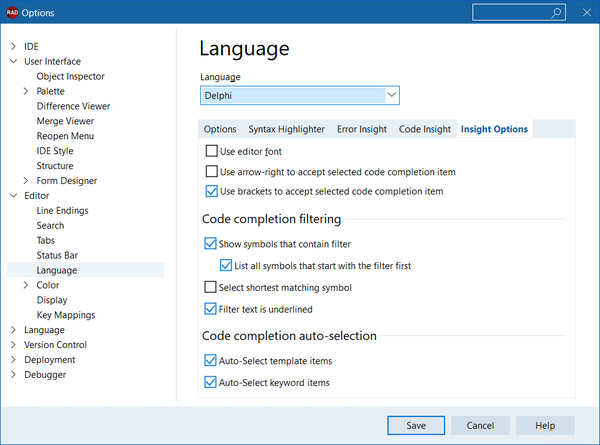
When using Code Completion, there are some code completion filters that you can configure in the Insight Options tab. Go to Tools > Options > Editor > Language and click Insight Options.
General Insight Options
- Use editor font: You can enable this option to use the editor font for code completion.
- Use arrow-right to accept selected code completion item: If enabled, accepts the item of your preference by pressing arrow-right.
- Use brackets to accept selected code completion item: This option is enabled by default, it accepts the item of your preference by using brackets.
Code Completion Filtering
Use these filters according to your needs:
- Show symbols that contain filter: this controls what symbols are included in the list. By default (checked), all symbols that contain the text you typed are listed. If the setting is turned off, the code completion list shows only symbols that start with what you typed.
- List all symbols that start with the filter first: symbols that start with what you typed (the 'filter') are sorted ahead of symbols that contain what you typed. If this is not checked, symbols are sorted alphabetically; if it is turned on, symbols that begin with the filter text are moved to the top of the list.
- Select shortest matching symbol: when the code completion list is shown, an entry is always auto-selected, or instead opens with the closest symbol in scope to where your coding is selected. This setting is checked by default (set to select the shortest) but turning it off will give you a closer behavior to classic code completion.
- Filter text is underlined: when checked, the code completion dropdown underlines text that matches what you type.
Code Completion Auto-Selection
- Auto-Select template items: Automatically choose the template items. This option is enabled by default.
- Tip: Code templates can be configured to display only in specific unit areas, such as in a type declaration.
If you want to use this in your templates, add the 'context' flag in a template. The "|" symbol indicates a location it can apply.:
• memberdecl: TFoo = class | end;
• methoddecl: procedure | or function |
• decl: var | or const |
• typedecl: type |
• methodbody: begin | end;
The vertical bar symbol ( | ) indicates a location it can apply, or any, which applies anywhere. - Warning: If a template has the same name as a keyword (such as ‘if’), the template will never be auto-selected by default.
- Auto-Select keyword items: This option selects automatically the keyword items when it is active.
This feature is enabled by default. Keep in mind that the keywords are auto-selected ahead of identifiers. This means that even when code completion automatically invokes whatever you type, as long as it is valid, it completes correctly.
Parameter Completion — Ctrl+Shift+Space
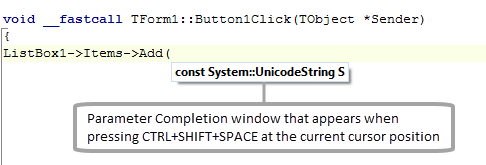
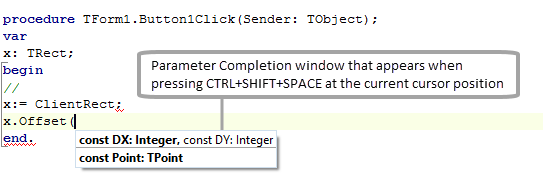
The Parameter Completion is auto-invoked after opening a left bracket of a function call, or pressing Ctrl+Shift+Space while using the Code Editor. A popup window displays a hint containing argument names and types for method calls. You can type characters to match those in the selection and press Return to insert the text in
the code at the cursor location. If the parameters have XMLDoc, they will be shown during parameter completion.
The parameter tooltip/help is shown when instantiating generic types.
Examples:
C++
Delphi
When code completion is set to auto-invoke, parameter completion will also automatically be shown when typing ( to begin writing parameters, allowing you to see both the list of parameters and Code Insight completion suggestions at the same time.
Code Hints
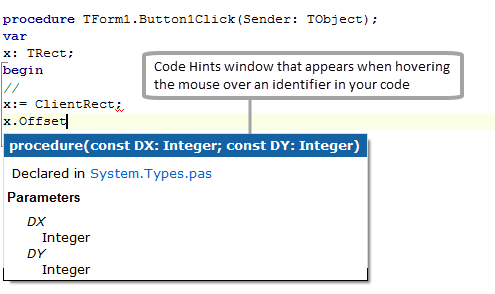
The Code Hints displays a hint containing information about the symbol such as type, file, and line number, where declared. You can display Code Hints by hovering the mouse over an identifier in your code while working in the Code Editor.
Code Hints only work for Delphi when you have disabled the Help Insight feature.
Example:
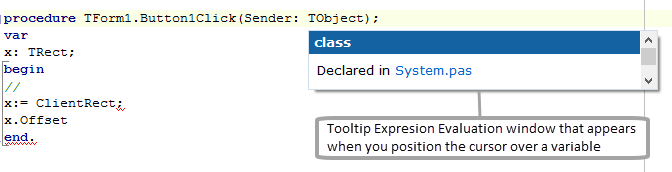
Tooltip Expression Evaluation
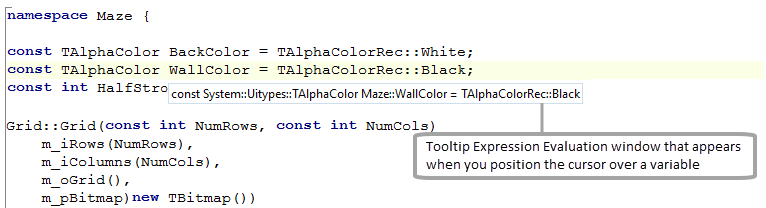
The Tooltip Expression Evaluation displays the current value of a variable when you position the cursor over it. This feature is available when the program execution is paused during a debugging session.
Examples:
C++
Delphi
Tooltip Insight
The Tooltip Insight displays information in a popup window when the mouse hovers above a symbol.
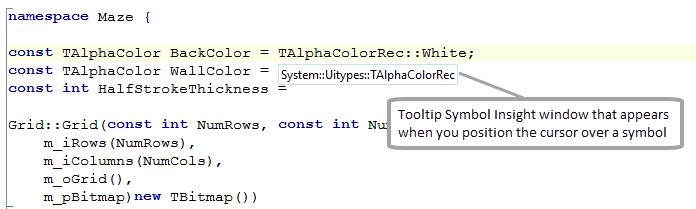
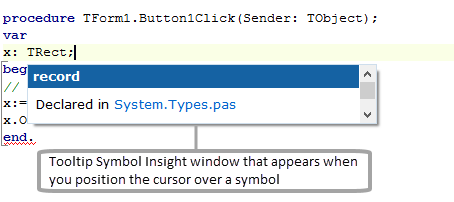
Tooltip Symbol Insight
The Tooltip Symbol Insight displays declaration information in a tooltip window for any identifier by passing the cursor over a symbol in the Code Editor.
Examples:
C++
Delphi
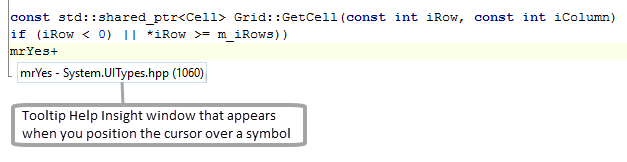
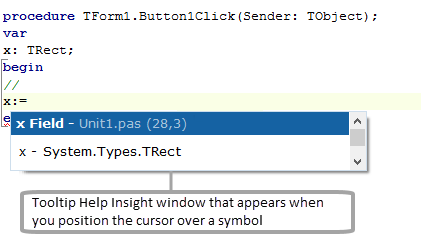
Tooltip Help Insight — Ctrl+Shift+H
The Tooltip Help Insight displays a hint containing information about the symbol such as type, file, line number was declared, and any XML documentation associated with the symbol (if available). It also works for generic classes, displays the exception info, and the line number for arrays and sets.
Invoke the Tooltip Help Insight by hovering the mouse over an identifier in your code, while working in the Code Editor. You can also invoke it by pressing Ctrl+Shift+H.
Examples:
C++
Delphi
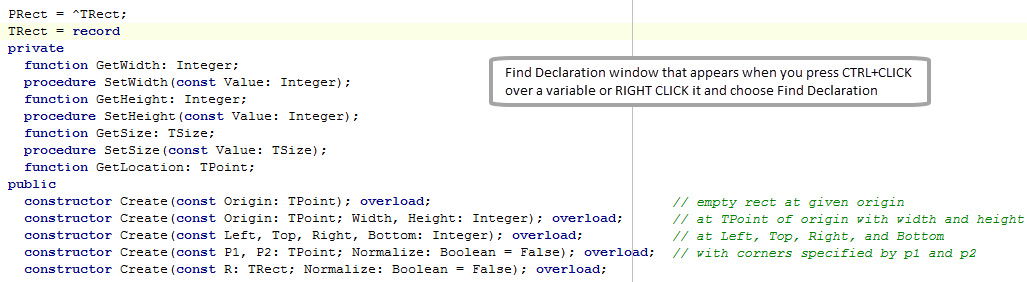
Find Declaration — Ctrl+Click
Find Declaration navigates to the location where a type or variable is defined.
While using the Code Editor you can use Ctrl+Click to automatically "jump to" the code that defines an identifier or the inherited method.
To browse code, hold down the Ctrl key while hovering the mouse over the name of any class, variable, property, method, or other identifiers.
The mouse pointer turns into a hand, and the identifier appears highlighted and underlined. Click the highlighted identifier, and the Code Editor jumps to the declaration of the identifier, opening the source file, if necessary. You can do the same thing by right-clicking an identifier and choosing Find Declaration. Pressing Alt+Left arrow returns you to where you browsed from.
You can also use Ctrl+Shift+Up/Down arrow to navigate between the declaration and implementation of a method.
When you press Ctrl+Shift+Down inside an inactive macro/ifdef, it will jump to the implementation of the next method declared.
The Find Declaration feature - Ctrl+Click works with:
- Symbols, such as variables, methods, properties, or other identifiers.
- Types, such as class, enum, record, arrays, or other types.
- Uses entries.
- Macros (defines) so that toggling between the implementation and declaration of a method works better when there are IFDEFs. The macros (defines) can be found if they are declared in an included file, affecting the above.
Find Declaration can also find and open only units in the project Search Path or Source Path, or in the product Browsing Path or Library Path. Directories are searched in the following order:
- The project Search Path (Delphi).
- The project Source Path, defined as the directory in which the project was saved.
- The global Browsing Path.
- The global Library Path.
- The Library Path, which is searched only if there is no project open in the IDE.
These paths can be modified by editing the corresponding values:
- Either the project-specific Search Path:
- Project > Options > Delphi Compiler
- The global Browsing Path and the Library Path for Delphi:
- Tools > Options > Environment Options > Delphi Options > Library
- The global library path is set on the Add Runtime Package dialog box.
Example:
Delphi
Block Completion — Enter key
Block Completion happens when you are missing code in the following situations:
- In C++, the block considered for completion is the code that is inside curly braces {}.
- In Delphi, the block considered for completion is the code that is inside a begin-end.
When you press Enter while working in the Code Editor and there is a code that is incorrectly closed, the Code Editor enters the closing token at the next available empty line after the current cursor position.
The drop-down menu sets the behavior of completion when you surround existing statements with symbols, as follows:
- Without new line - Positions the cursor after the code you just typed.
- With new line - Positions the cursor inside the code you just typed.
- New blocks only - Invokes completion only if you start a new block.
Class Completion — Ctrl+Shift+C
Class Completion simplifies the process of defining and implementing new classes by generating skeleton code for the class members that you declare.
Position the cursor within a class declaration in the interface section of a unit and press Ctrl+Shift+C.
Any unfinished property declarations are completed.
For any methods that require implementation, empty methods are added to the implementation section.
Class Completion can also be achieved by choosing the option Complete class at cursor from the Code Editor context menu.
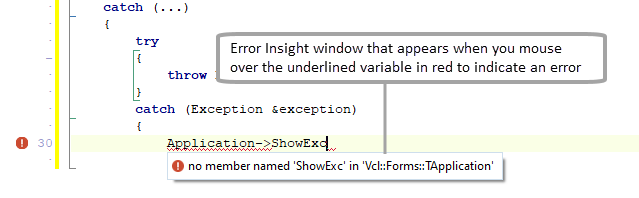
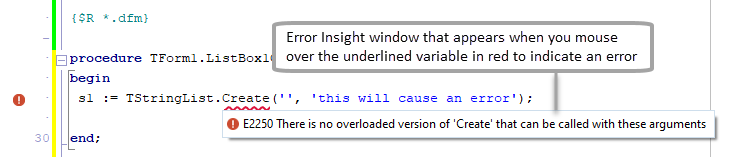
Error Insight
The Error Insight feature underlines code that may need attention. This includes invalid code causing errors (a red underline); warnings (orange underline); and/or hints (blue underline). You can choose the severity level of the issues that are displayed in the editor, such as to display only errors but not warnings or hints.
Positioning the cursor over invalid text displays a tooltip window containing the probable cause of the error.
Examples:
C++
Delphi
In addition, the list of errors generated by the expression appears in the Errors pane of the Structure View.
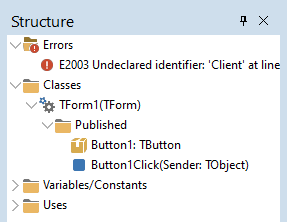
In the Editor Status bar, you can find an Error Insight summary displaying how many errors, warnings, and/or hints are in the current file.
![]()
Go to Tools > Options > Editor > Language and click on Error Insight to configure its properties.
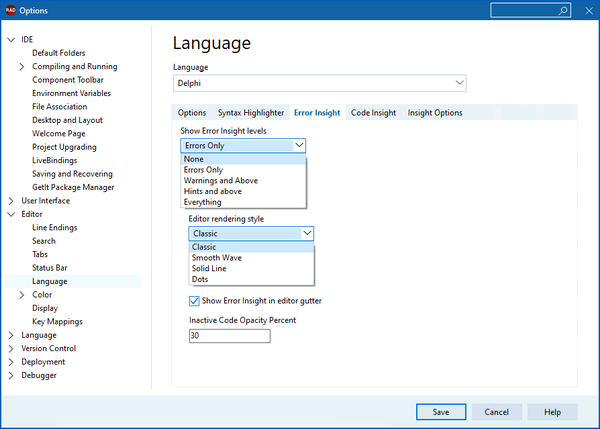
- Show Error insight levels: determines the level of error insight you want to see in the code editor. The options you have are the following:
- None: choose this option to not display any level of error insight in the code editor.
- Errors Only: displays errors only in the code editor. Errors are displayed with a red squiggle.
- Warnings and Above: displays warnings in the code editor. Warnings are displayed with an orange squiggle.
- Hints and above: displays hints in the code editor. Hints are displayed with a blue squiggle.
- Everything: displays all levels of error insight in the code editor.
- Editor rendering style: determines the underline style, choices are:
Classic,Smooth Wave,Solid Line, orDots. - Show Error Insight in editor gutter: enable/disable this option to find errors, warnings, and/or hints icons at their specific location while scrolling the file in the code editor.
- Inactive Code Opacity Percent: for Delphi, draws inactive (ifdef-ed out) code semi-transparent. This applies the opacity percent of your preference, you can choose a value from 0 to 100.
If you have issues with the Error Insight feature:
- Close the IDE
- Open the Registry Editor
- Navigate to
HKEY_CURRENT_USER\Software\Embarcadero\BDS\23.0\Editor\Source Options\Borland.EditOptions.Pascalfolder - Delete the ErrorInsightLevel key
- Restart the IDE
Index for C++ Insights
The Index for C++ Insights provides an index for the Tooltip Insight and Find Declaration features.
It is the Language Server Protocol (LSP) server (cquery) that runs through the project and builds a database. It uses CPU, so it can be turned off through the Index for C++ Insights checkbox.
This setting applies only to C++ and Clang-enhanced compilers.
For the Clang-enhanced compiler, this feature uses a Language Server Protocol (LSP) server. It is asynchronous and non-blocking.When working with Clang-enhanced compilers and the Index for C++ Insights feature is enabled, the project that you open is opened indexed. It also creates a database for the Tooltip Insight and Find Declaration features. It uses CPU and it can be turned off by unchecking the Index for C++ Insights checkbox.
LSP Behavior
The LSP behavior tab controls how the cquery LSP server indexes files. In other words, the way it stores information that will be used to fulfill code completion, navigation, etc.
- Indexing can be very CPU intensive and you cannot use Code Insight until it is complete.
- Restarting the server when changing platforms clears the index.
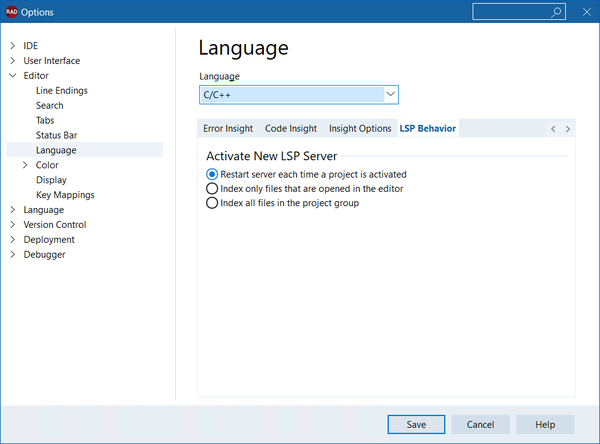
There are three alternatives in the LSP Behavior tab:
- Restart server each time a project is activated: Indexes all files in a project, along with all files opened in the editor. It is the most CPU-intensive option, with the benefit that the entire project is available in the index. With this option, the LSP server is restarted every time you select a new active project in the Projects view, or you change the project options or the platform options.
on by default.- Index only files that are opened in the editor: Indexes only the files you open, regardless of your project. It is a CPU less intensive and the Code Insight is available more quickly. However, it means a short delay before Code Insight is available each time you open a file. With this option the LSP server is never shut down or restarted unless you close all projects or project groups, or you change the project options or platform options.
- Index all files in the project group: Indexes all files in all projects when the project group is loaded. The LSP server is never shut down or restarted unless you close all projects and project groups, or you change the project options or platform options.
Advanced Options
Tools API Support
Code Insight support is mainly focused around the Language Server Protocol, and there is a generic LSP support, where you can create a New LSP server using the above dialog. However, the IDE implements two things: generic asynchronous code insight; and then LSP support, which is a specific implementation of asynchronous code insight.
The ToolsAPI defines a number of new types and interfaces for async code insight. The LSP uses these interfaces, but you can write a code insight provider that is asynchronous with any implementation you wish.
The interfaces are located in ToolsAPI.pas:
IOTAAsyncCodeInsightManageris the main interface for a generic async code insight manager implementation. It uses a number of callbacks, which are defined above it.
IOTACodeInsightUIOverrideis used to override specific UI behavior.
Filing Bugs and Log Files
To fill bugs and log files, see the Troubleshooting: Delphi LSP and Troubleshooting: C++ Visual Assist and C++ LSP.