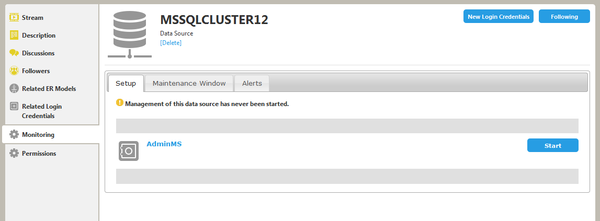
Monitoring
Go Up to Data Source Pages
The Data Sources Monitoring tab allows you to turn on Data Source metric alerts.
The monitored metrics are:
- Host Ping Time
- SQL Statements Executed
- Processor Count
- Percentage Space Used
- Query Response Time
- Space Used
- DB Ping Time
- Logins
- Percentage Space Available
- Space Available
- Online/Offline availability.
![]() Note: To set up Monitoring, you will need to have a set of login credentials configured for your data source. You must also use the test connection button to initialize the link which will verify the connectivity.
Note: To set up Monitoring, you will need to have a set of login credentials configured for your data source. You must also use the test connection button to initialize the link which will verify the connectivity.
Click Start for the login credential you tested previously to start recording metrics.
Then you can view the data source metrics in the data source description.
