Session 2: Using Analysis and Reporting Tools
Go Up to Capacity Analyst Tutorial
After several hourly updates of the statistics in the collection you created in Session 1, you are ready to start using the analysis tools. In Session 2, you will experiment with the Collection Analysis Viewer and generate one of the Capacity Analyst predefined reports.
Contents
Performing Trend Analysis Using Capacity Analyst
The Collection Analysis Viewer presents selected statistics in a graphical format and lets you view historical trends and extrapolate that data into the future.
To open the Collection Analysis Viewer, do the following
- Start DBArtisan again, and connect to the datasource you created earlier. If you need help, refer to Starting DBArtisan and Connecting to a Datasource.
- On the Analyst menu, select Capacity Analyst.
- Select the Capacity Collection that you recently created.
- On the Capacity Analyst toolbar, click the Collection Analysis Viewer button.
Choosing the Charted Metrics You Want To View
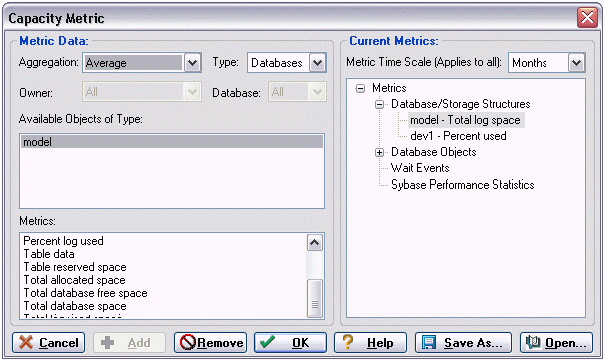
The first time that you open the Collection Analysis Viewer, it prompts you select the metrics you want to work with. You specify the metrics using the displayed Capacity Metric dialog. For example:
To specify the metrics that are to appear in the analysis
- From the Aggregation dropdown, select an aggregation type: Average, Maximum, or Minimum.
- From the Type dropdown, select the type of metric you want to add, such as a table or index.
- Note: Certain Metric types allow you to further qualify using the Owner and Database dropdowns.
- From the Available Object of Type list, choose a specific object or statistics type.
- The Metrics list is updated with the metrics available for the Type and Available Objects of Type selections you made.
- Select a metric from the Metrics list and click Add.
- Capacity Analyst adds the metric to the Current Metrics list.
- To add additional metrics, repeats Step 1 through Step 4. Keep in mind that the Collection Analysis VIew will calibrate its chart according to the metric with the largest value. If you are going to add multiple metrics, choose metrics that you expect will have similar ranges.
- When finished adding metrics for the graphical portion of your analysis, click OK.
Viewing Trends in Capacity Analyst
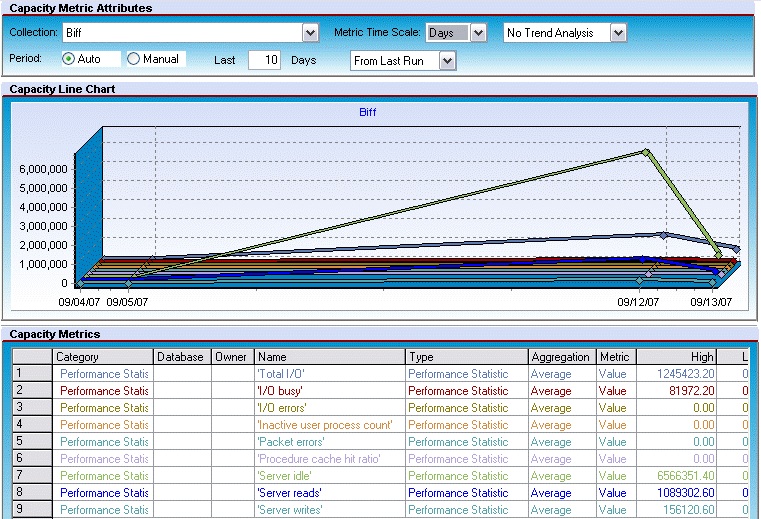
When you finish adding metrics to the Collection Analysis Viewer, Capacity Analyst presents the data in graphical and grid form in the Collection Analysis Viewer. Your first step should be to ensure that the displayed timescale reflects the fact that you have been updating metrics for a matter of hours. You do this using the controls in the Capacity Metric Attributes area.
To optimize viewing of the metrics in your collection
- From the Metric Time Scale dropdown, choose Hours.
- In the Last box, enter the number of hours since you scheduled your collection for hourly updates.
- Having only statistics that cover a matter of hours, your viewing options are currently somewhat restrictive. However, during a later session you may want to experiment with the following viewing options:
- By default, the No Trend Analysis option is selected. This option shows historical data only. If you want statistics extrapolated into the future, you can use the Trend to Date or Trend to Value options to help you predict potential problems.
- You are currently using the Auto Period. It lets you quickly select an interval from the current day or the last statistics update. The Manual option lets you to have more granular control over the exact dates/times that Capacity Analyst uses to plot the data.
- To display the actual data values, position the pointer over the trend lines in the graph. Pop up values display the exact points on the chart.
- Each metric’s statistic displays in the Analysis viewer’s bottom grid with the high, low, and average value for the time period being shown for each metric.
- After your data has been displayed, you can continue to add or remove metrics from the Collection Analysis Viewer by using the Add or Remove toolbar buttons, and perform other functions using the various options available on the Collection Analysis viewer.
- When ready to proceed to the next exercise, on the Capacity Analyst toolbar click the Close the Active Tab button.
Using Capacity Analyst Predefined Reports
An alternative forecasting method is through use of predefined Analysis reports. Capacity Analyst provides reports on growth trends of devices, databases, tables, rows, and other objects, as well as reports on fragmentation details and failure prediction. Like the COllection Analysis View, the reports show historical data and can be configured to extrapolate to a future date.
To generate a report on the fastest growing database objects
- Ensure that the collection you created is selected.
- Click the Report button.
- To create a pre-defined trend analysis report, select Analysis Report and click OK.
- The Capacity Analyst opens the Capacity Analyst Report Wizard.
- Accept the default to create a New Analysis Report.
- Click Next.
- From the report drop down list, select ‘N” Fastest Growing Objects. Note that there are many other reports available.
- Accept the default Auto Entry time period of 1 day.
- Accept the Day default rollup.
- Specify the future date you want Capacity Analyst to use for its future ‘stop’ date.
- Click Next.
- Specify what databases/objects to include in the report.
- Click Next.
- Specify a Report File Name and a Report Title.
- Click Execute.
- Capacity Analyst opens the report in a new tab and stores an HTML-based version of the report in the location you specified in the Report File Name field.
The HTML report can be viewed in any web browser so you can build internal web sites of your forecasts for all interested parties, including project leads, and operation managers.


