AAS
Contents
AAS - Average Active Sessions
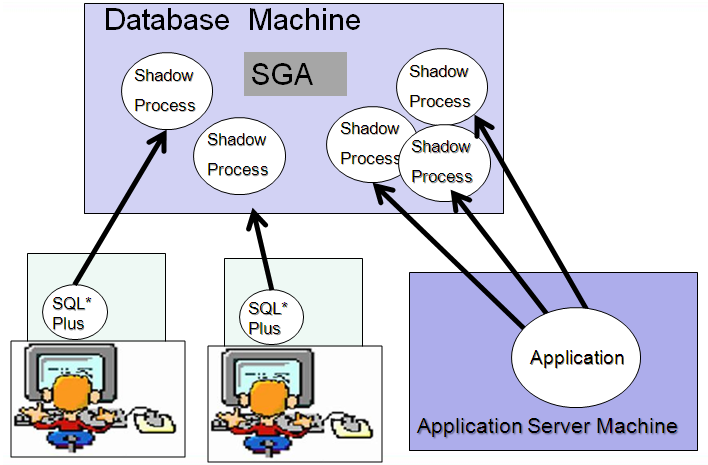
A database can have users connected via tools like SQL*Plus, SQL*Forms etc or an Application Server connecting to the database to process information and/or provide that information to front end web clients or other applications. For each connection to the database there is a shadow process that that executes the actions on the database for the user or application.
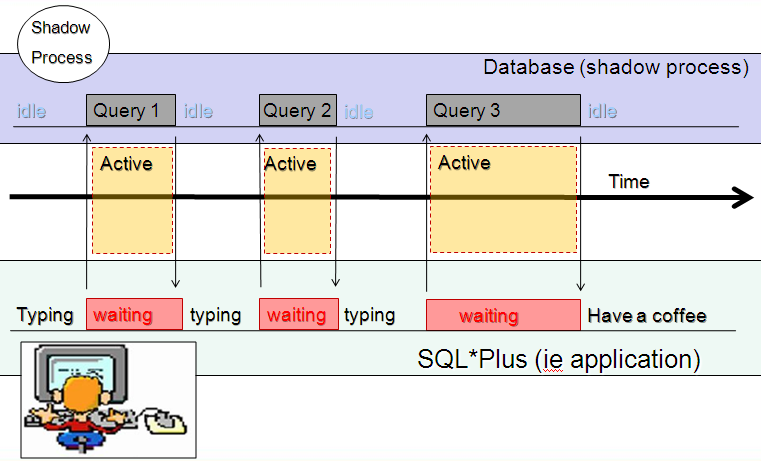
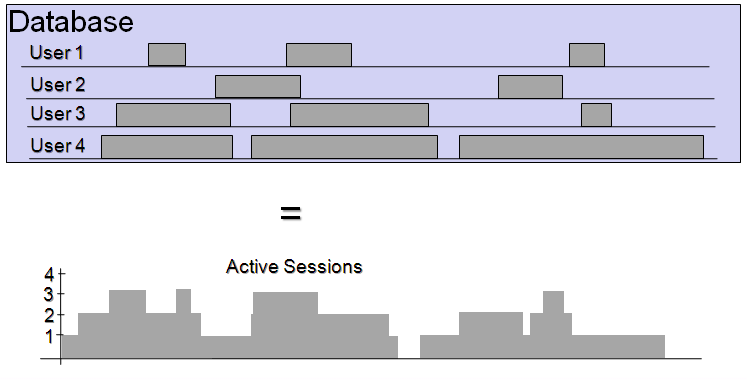
A user (or application) sends queries to the database, and while the query is executing, the shadow process on the database machine is " active" processing that query. The user, meanwhile is waiting for the results of that query and their database connection is blocked until the query returns. On the flip side, when the users is typing or getting a coffee, or in the case of an application, possibly doing some application side processing, the shadow process is idle and waiting for more work to do. The measure of active sessions is simply the sum of all the active sessions in the database.
Active Sessions
For every active session in the database there is a user or application waiting
Sessions Waiting
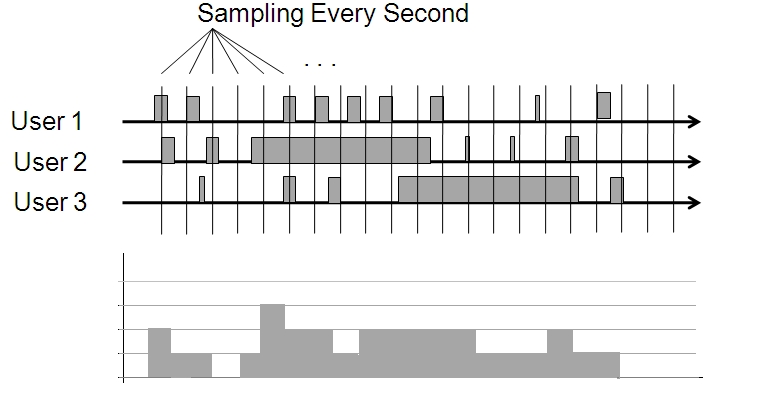
Sampling Session (query) Activity
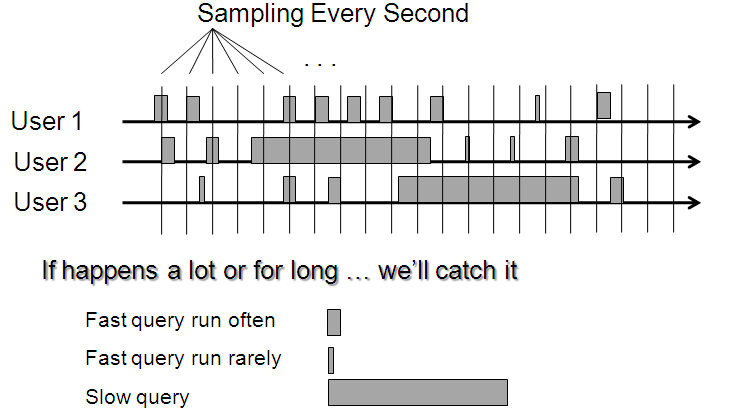
Activity is sampled every second (by default in Oracle's ASH and DB Optimizer and S-ASH)
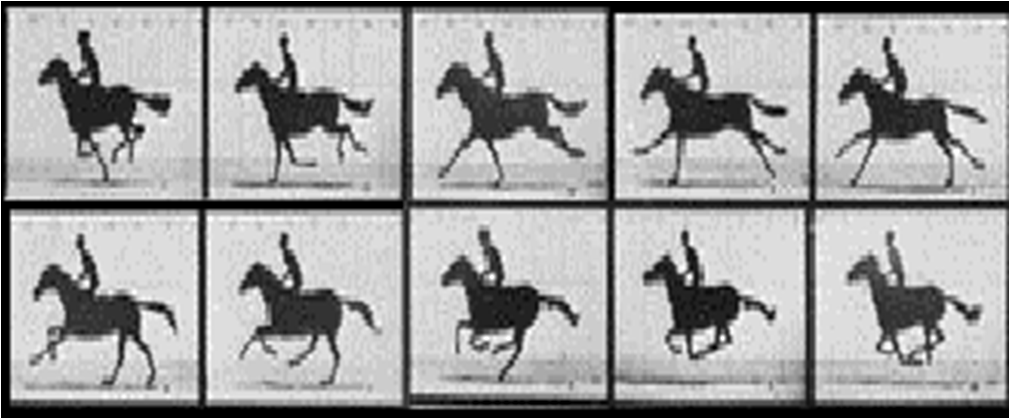
Sampling is like taking film. Not everything is captured but the amount of data that is captured is sufficient for a clear picture of what happened.
Session Activity Components
We can say more about activity than simple whether a session is active or not
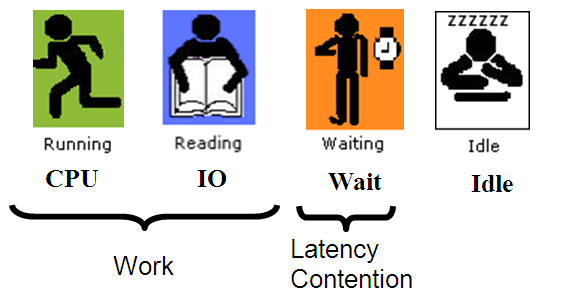
We can break down the activity into it's components such as time on CPU, doing IO or waiting for resources.
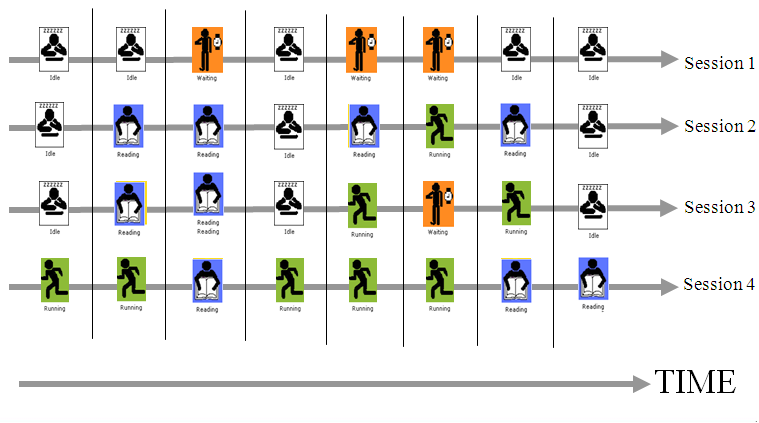
Sessions change state faster than we can catch, but we can get the big picture.
Knowing everything is impossible and the amount of data would overwhelming but knowing enough is possible and manageable.
Session Activity Graphically
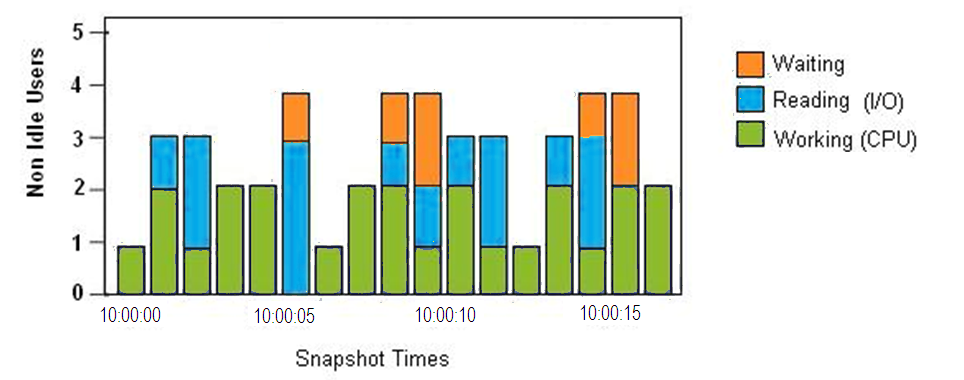
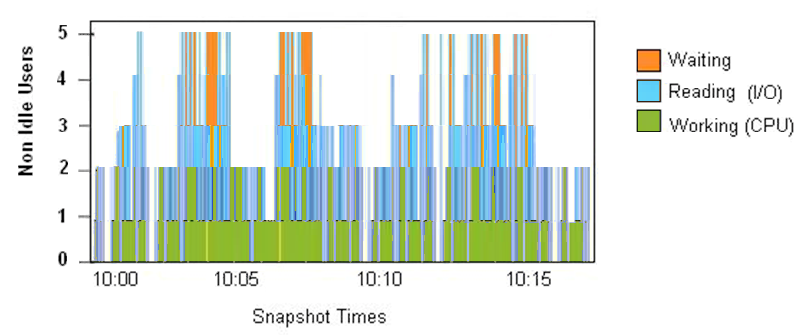
Every second we sample which sessions are active and if they are active, what their session state is. To represent this graphically we can just stack the results in a bar chart:
The issue with showing the per second results is that the lines become too thin and unreadable:
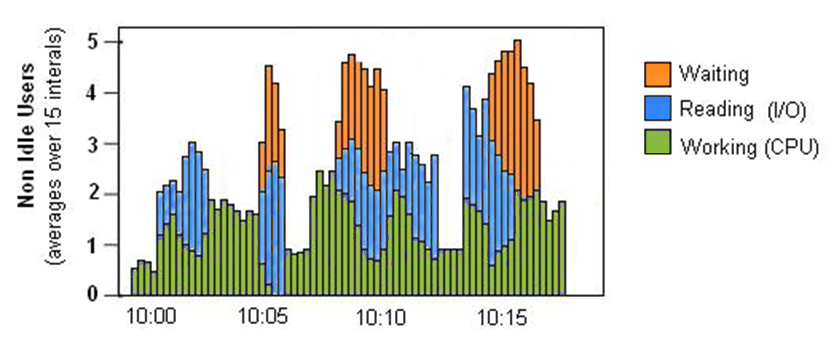
So instead we take multiple samples and average them (in Oracle OEM it's 15second wide bars, in DB Optimizer its 5 second wide bars)
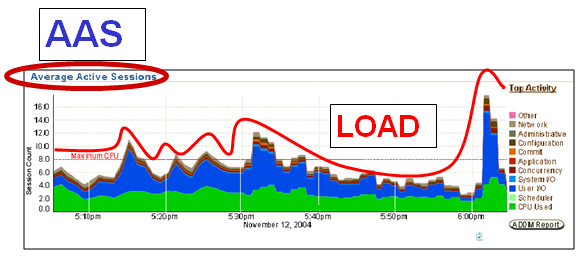
Now we have the graph of "average active sessions", ie AAS
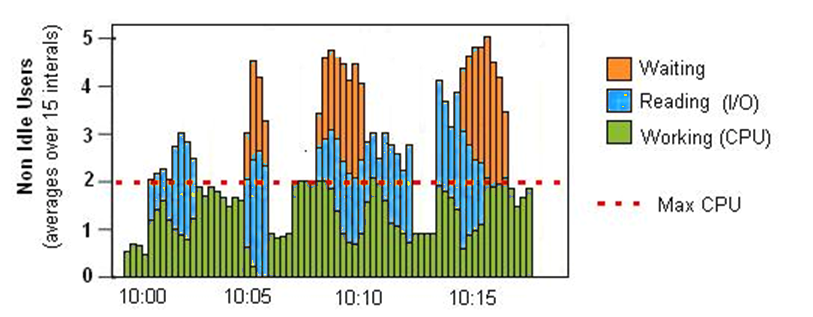
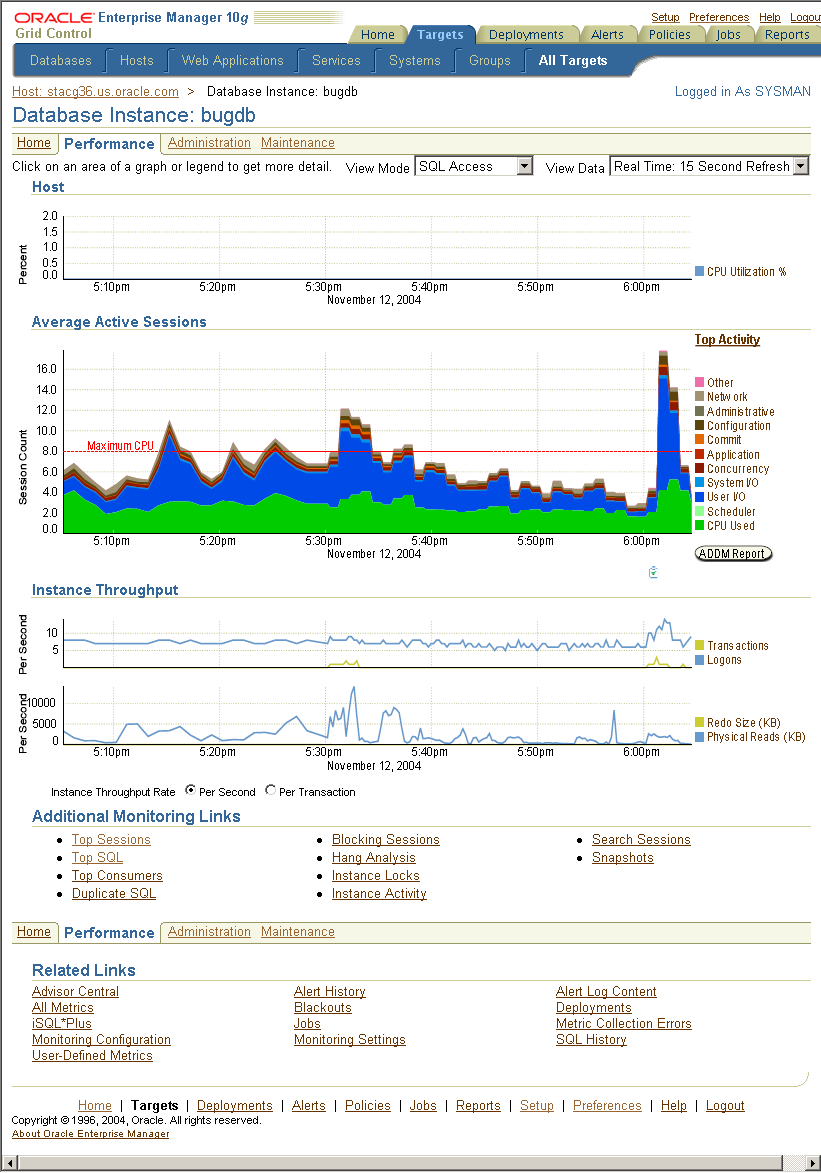
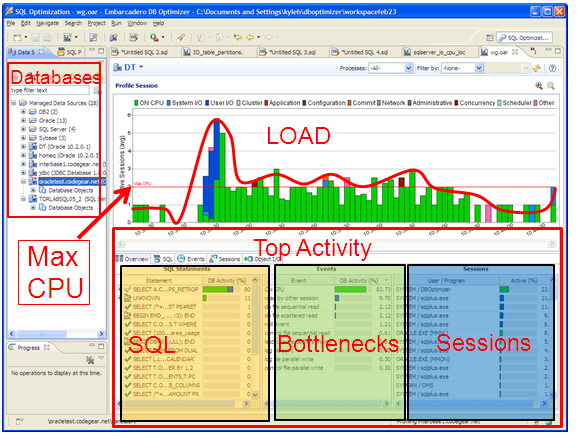
One final piece is adding the "Max CPU" line which is the number CPUs on the box (or accessible to the VM) . The Max CPU line is our point of reference. If load goes above the "Max CPU" line then we have a bottleneck.
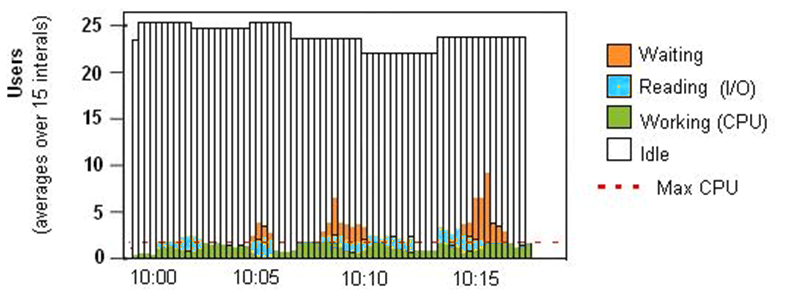
Why don't we graph the idle connections as well? Well, it's a possibility but would have to be on a different graph because if we displayed it in the AAS chart, it would change the scale massively and all the important data on active sessions would become difficult to read.
Now that we have a graph of AAS what can we do with it?
The middle graph in OEM's performance page is a measurement of AAS, ie the average number of sessions active (in OEM it's averaged over 15 seconds)
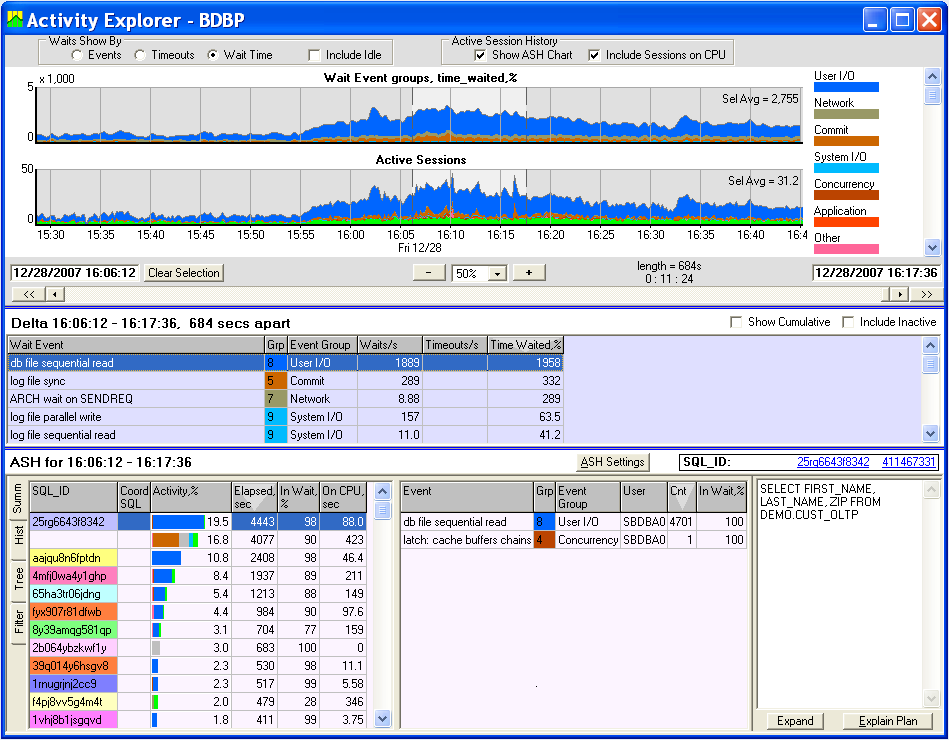
AAS in Quest's Performance Analyzer
AAS in Lab 128
AAS in DB Optimizer:
Use CPU count as yardstick:
- AAS < 1
- Database is not blocked
- AAS ~= 0
- Database basically idle
- Problems are in the APP not DB
- AAS < # of CPUs
- CPU available
- If there are no sessions spending 100% of there time waiting, then the database is not blocked
- AAS > # of CPUs
- Could have performance problems
- AAS >> # of CPUS
- AAS < 1
:**There is a bottleneck
Basically if AAS is larger than the max CPU line we have some sort of bottleneck. How big the bottleneck depends on the kind so of bottleneck (what kind of waits we are seeng) and what the application is like. For example some applications typically have an acceptable amount of time waiting for IO , such as data ware house, where as others should have hardly no wait IO, such as OLTP. In all cases though CPU demand should never go above the max CPU line or there is definitely a bottleneck for CPU.
NOTE: when ever AAS > 1, there might be user who is completely blocked. NOTE: These "rules" for AAS are base on no other major applications running on the machine. If there are other applications running on the machine, the the "MAX CPU" line will actually be lower and will vary with how much CPU is available on the machine. It would be cool to actually graph the available CPU for the instance on the load chart.
Measuring AAS
AAS can be measured easily with Active Session History (ASH). ASH samples every second how many session are active.
There is another method though using the statistics that measure time spent in the database
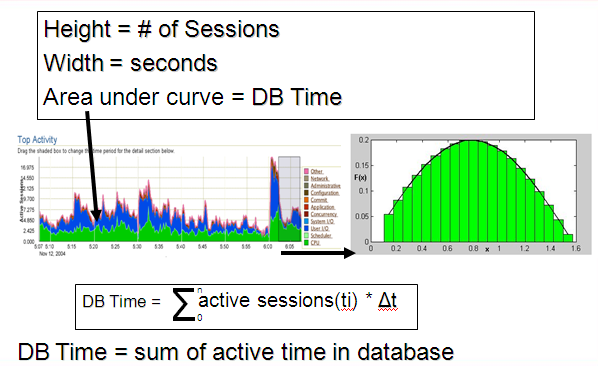
Average Active Sessions is also a measurement of DB Time or time spent active in the database by all users. DB Time is a new statistics that is track in Oracle starting in 10g. DB Time can also be calculated by summing all the wait time plus CPU time.
IF
- DB Time = sum of average active sessions * amount of time active
then
- AAS = DB Time / elapsed time
Interestingly enough Oracle uses both of these approaches to graph AAS. On the main performance page Oracle uses DB Time and on the Top Activity page they use ASH which is the counts of active sessions every sample, sampling at once a second.
DB Time (DBT) = Time Spent in Database
DB Time (10g) = select value from v$sysstat where name = ‘DB time’;
DB Time (9i) = Select sum(time_waited) from v$system_event where event not in ( ... idle events …);
- +
- Select value from v$sysstat where name = ‘CPU used by this session’;
Note : still need to take delta values in the above calculations. Oracle statistics are cumulative since database startup, so have to take a value at time A them time B and subtract the A values from the B values.
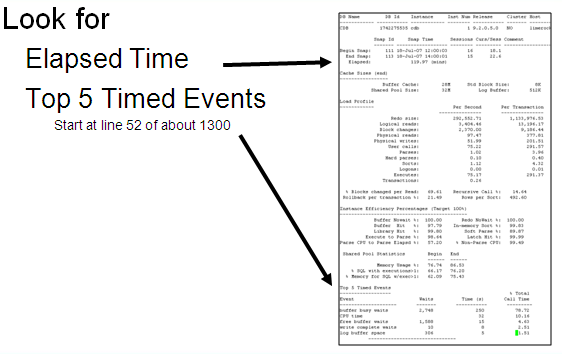
AAS from statspack
a
   STATSPACK report for
   DB Name    DB Id    Instance Inst Num Release    RAC   Host
   ------- ----------- -------- -------- ---------- --- -------
   LABSF03 1420044432   labsf03        1 10.1.0.2.0  NO  labsfr

                Snap Id     Snap Time       Sessions Curs/Sess
               --------- ------------------ -------- ---------
   Begin Snap:         1 03-Apr-06 12:34:06       18       5.6
     End Snap:         2 03-Apr-06 12:34:36       18       4.8
      Elapsed:                1.00 (mins)
...
   Top 5 Timed Events
   17:25, 26 March 2010 (PDT)17:25, 26 March 2010 (PDT)17:25, 26 March 2010 (PDT)Tubetti                               % Total
   Event                     Waits   Time (s)     Call Time
   ---------------------  ---------  ---------     -------
   buffer busy waits          2,748         250      78.72
   CPU time                                  32      10.16
   free buffer waits          1,588          15       4.63
   write complete waits          10           8       2.51
   log buffer space             306           5       1.51
DBTIME= CPU + WAITS
CPU = 32
       WAITS = 250+15+8+5 = 278 secs
       ----------------------------------------
DBTIME=320
Elapsed Time = 60 secs
AAS = 320 secs / 60 secs = 5.1
AWR AAS
WORKLOAD REPOSITORY report for
   DB Name         DB Id    Instance     Inst Num Release     RAC Host
   ------------ ----------- ------------ -------- ----------- --- ------------
   CDB10         1193559071 cdb10               1 10.2.0.1.0  NO  tsukuba
                 Snap Id      Snap Time      Sessions Curs/Sess
               --------- ------------------- -------- ---------
   Begin Snap:       122 31-Jul-07 17:00:40        36      24.9
     End Snap:       123 31-Jul-07 18:00:56        37      25.0
      Elapsed:               60.26 (mins)
      DB Time:               89.57 (mins)
AAS = 89.57/60.26 = 1.5
