Waits
Contents
WAITS
Finally pure waits. These are the waits that we should be able to eliminate from the system theoretically. The one exception to that might be "log file sync" which happens at commit time but can be minimized by having fast log file devices even going to solid state and limiting the commit frequency. In general if we see other waits and they are important relative to the amount of CPU time spent then we have a clear opportunity for performance tuning. Waits are classified by WAIT_CLASS
- Select wait_class, count(*) from V$EVENT_NAME where WAIT_CLASS not in ('Idle','User I/O') group by WAIT_CLASS order by WAIT_CLASS;
| WAIT_CLASS | COUNT(*) |
| Administrative | 46 |
| Application | 12 |
| Cluster | 47 |
| Commit | 1 |
| Concurrencyv | 25 |
| Configuration | 23 |
| Network | 27 |
| Other | 590 |
| Scheduler | 2 |
| System I/O | 24 |
Over 800 waits, though almost 75% of the are "Other", ie they shouldn't happen in normal circumstances.
ASH
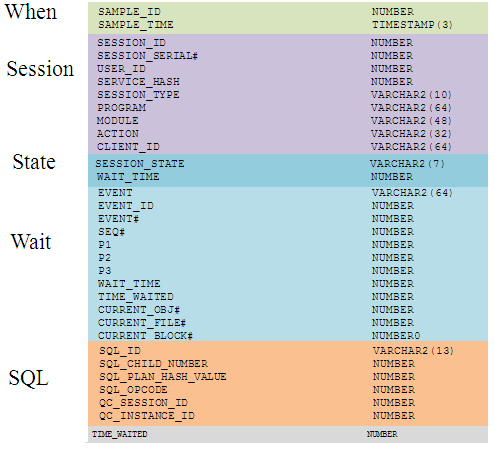
Not only does Oracle collect the active sessions, their session state and they SQL they are executing but Oracle collects a lot more information and stores it in a table V$ACTIVE_SESSION_HISTORY
| Name | Null? | Type |
| SAMPLE_ID | NUMBER | |
| SAMPLE_TIME | TIMESTAMP(3) | |
| SESSION_ID | NUMBER | |
| SESSION_SERIAL# | NUMBER | |
| USER_ID | NUMBER | |
| SQL_ID | VARCHAR2(13) | |
| SQL_CHILD_NUMBER | NUMBER | |
| SQL_PLAN_HASH_VALUE | NUMBER | |
| SQL_OPCODE | NUMBER | |
| SERVICE_HASH | NUMBER
| |
| SESSION_TYPE | VARCHAR2(10)
| |
| SESSION_STATE | VARCHAR2(7)
| |
| QC_SESSION_ID | NUMBER
| |
| QC_INSTANCE_ID | NUMBER
| |
| EVENT | VARCHAR2(64)
| |
| EVENT_ID | NUMBER
| |
| EVENT# | NUMBER
| |
| SEQ# | NUMBER
| |
| P1 | NUMBER
| |
| P2 | NUMBER
| |
| P3 | NUMBER
| |
| WAIT_TIME | NUMBER
| |
| TIME_WAITED | NUMBER
| |
| CURRENT_OBJ# | NUMBER
| |
| CURRENT_FILE# | NUMBER
| |
| CURRENT_BLOCK# | NUMBER
| |
| PROGRAM | VARCHAR2(48)
| |
| MODULE | VARCHAR2(48)
| |
| ACTION | VARCHAR2(32)
| |
| CLIENT_ID | VARCHAR2(64) |
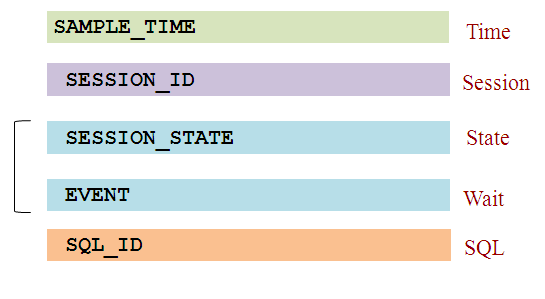
Looks like a lot of fields! Let's break it down into bite sizes logical pieces:
Of these fields the basic information is
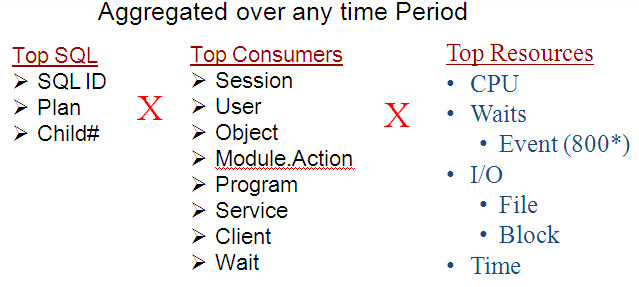
But all of the fields of ASH allow large number of options for aggregation and analysis such as
and starting in 10.2.0.3 Oracle as Package and Procedure so we can find the top Package and Procedure by all the resources listed above such as CPU, WAIT, IO or TIME.
ASH is multidimensional data that can be group in many ways.
Who is creating the load:
| Session Identifiers : | |
| SESSION_ID | |
| SESSION_SERIAL# | (identify SID reuse) |
| SESSION_TYPE | (FOREGROUND,BACKGROUND) |
| grouping options : |
|
| USER_ID | (SYS, SYSTEM, SCOTT etc) |
| SERVICE_HASH | (OE,GL,HR) |
| MODULE.ACTION | (PLSQL tagging) |
| CLIENT_ID | (identifying users in session pool) |
| PROGRAM | (SQL, JDBC, Forms etc) |
SQL Identfiers
| SQL_ID |
| QC_SESSION_ID (Query Coordinator) |
| QC_INSTANCE_ID (RAC) |
Wait Information
| EVENT |
| P1 |
| P2 |
| P3 |
Object information (IO, buffer busy wait, lock enqueue TX waits only)
| CURRENT_OBJ# |
| CURRENT_FILE#
|
| CURRENT_BLOCK# |
Top CPU consuming Session in last 5 minutes?
- Select
- session_id,
- count(*)
- from
- v$active_session_history
- where
- session_state= ‘ON CPU‘ and
- SAMPLE_TIME > sysdate – (5/(24*60))
- group by
- session_id
- order by
- count(*) desc;
| SESSION_ID | COUNT(*) |
| 257 | 299
|
| 263 | 62
|
| 256 | 32
|
| 264 | 9
|
| 277 | 3
|
| 258 | 1 |
Top Waiting Session in last 5 minutes
- Select
- session_id,
- count(*)
- from
- v$active_session_history
- where
- session_state=‘WAITING’ and
- SAMPLE_TIME > SYSDATE - (5/(24*60))
- group by
- session_id
- order by
- count(*) desc;
| SESSION_ID | COUNT(*) |
| 272 | 224 |
| 254 | 8 |
| 249 | 5 |
| 276 | 5 |
| 277 | 4 |
| 270 | 1 |
Top SQL by CPU usage, wait time and IO time
- select
- ash.SQL_ID
- sum(decode(ash.session_state,'ON CPU',1,0)) "CPU",
- sum(decode(ash.session_state,'WAITING',1,0)) -
- sum(decode(ash.session_state,'WAITING', decode(en.wait_class, 'User I/O',1,0),0)) "WAIT" ,
- sum(decode(ash.session_state,'WAITING', decode(en.wait_class, 'User I/O',1,0),0)) "IO" ,
- sum(decode(ash.session_state,'ON CPU',1,1)) "TOTAL"
- from v$active_session_history ash,
- v$event_name en
- where SQL_ID is not NULL and en.event#=ash.event#
- group by sql_id
- order by sum(decode(session_state,'ON CPU',1,1)) desc
| SQL_ID | CPU | WAITING | IO | TOTAL
|
| 4c1xvq9ufwcjc | 23386 | 0 | 0 | 23386 |
| 6wjw6rz5uvbp3 | 99 | 0 | 23 | 122
|
| 968dm8hr9qd03 | 97 | 0 | 22 | 119
|
| 938jp5gasmrah | 90 | 0 | 25 | 115
|
| cv8xnv81kf582 | 42 | 0 | 9 | 51
|
| 6p9bzu19v965k | 21 | 0 | 0 | 21
|
| 5zu8pxnun66bu | 15 | 0 | 0 | 15
|
| db2jr13nup72v | 9 | 0 | 0 | 9
|
| 7ks5gnj38hghv | 8 | 0 | 0 | 8 |
Top SESSION by CPU usage, wait time and IO time
select
- ash.session_id,
- ash.session_serial#,
- ash.user_id,
- ash.program,
- sum(decode(ash.session_state,'ON CPU',1,0)) "CPU",
- sum(decode(ash.session_state,'WAITING',1,0)) -
- sum(decode(ash.session_state,'WAITING',
- decode(en.wait_class,'User I/O',1, 0 ), 0)) "WAITING" ,
- sum(decode(ash.session_state,'WAITING',
- decode(en.wait_class,'User I/O',1, 0 ), 0)) "IO" ,
- sum(decode(session_state,'ON CPU',1,1)) "TOTAL"
- from v$active_session_history ash,
- v$event_name en
- where en.event# = ash.event#
- group by session_id,user_id,session_serial#,program
- order by sum(decode(session_state,'ON CPU',1,1))
| SESSION_ID | SERIAL# | USER_ID | PROGRAM | CPU | WAITINGv | IO |
| 247 | 61970 | 1 | sqlplus | 11698 | 0 | 0
|
| 277 | 1 | 0 | oracle@labsfrh903 (LGWR) | 14 | 21 | 0
|
| 276 | 1 | 0 | oracle@labsfrh903 (CKPT) | 19 | 10 | 0
|
| 278 | 1 | 0 | oracle@labsfrh903 (DBW0) | 29 | 0 | 0
|
| 280 | 1 | 0 | oracle@labsfrh903 (PMON) | 19 | 0 | 0
|
| 254 | 22617 | 5 | Executor.exe | 13 | 0 | 3
|
| 255 | 12877 | 5 | Executor.exe | 11 | 0 | 5
|
| 257 | 33729 | 5 | Executor.exe | 15 | 0 | 1
|
| 255 | 13417 | 5 | Executor.exe | 14 | 0 | 2 |
Top SQL with Username and connection status
- select
- decode(nvl(to_char(s.sid),-1),-1, 'DISCONNECTED','CONNECTED' )
- "STATUS",
- topsession.session_id "SESSION_ID",
- u.name "NAME",
- topsession.program "PROGRAM",
- max(topsession.CPU) "CPU",
- max(topsession.WAITING) "WAITING",
- max(topsession.IO) "IO",
- max(topsession.TOTAL) "TOTAL"
- from {previous query} topsession,
- v$session s,
- user$ u
- where
- u.user# =topsession.user_id and
- /* outer join to v$session because the session might be disconnected */
- topsession.session_id = s.sid (+) and'
- topsession.session_serial# = s.serial# (+)'
- group by topsession.session_id, topsession.session_serial#, topsession.user_id,
- topsession.program, s.username,s.sid,s.paddr,u.name
- order by max(topsession.TOTAL) desc
| STATUS | SESSION_ID | NAME | PROGRAM | CPU | WAITING | IO |
| CONNECTED | 247 | CPU_Monger | ChMgr304.exe | 11704 | 0 | 0 |
| CONNECTED | 277 | SYS | oracle@labsfrh903 (LGWR) | 14 | 19 | 0 |
| CONNECTED | 278 | SYS | oracle@labsfrh903 (DBW0) | 29 | 0 | 0
|
| CONNECTED | 276 | SYS | oracle@labsfrh903 (CKPT) | 18 | 9 | 0
|
| CONNECTED | 280 | SYS | oracle@labsfrh903 (PMON) | 20 | 0 | 0
|
| DISCONNECTED | 255 | SYSTEM | Executor.exe | 11 | 4 | 5
|
| DISCONNECTED | 257 | SYSTEM | Executor.exe | 13 | 0 | 3
|
| DISCONNECTED | 255 | SYSTEM | Executor.exe | 14 | 0 | 2
|
| DISCONNECTED | 257 | SYSTEM | Executor.exe | 13 | 0 | 3 |
Note on Active or Waiting
- SESSION_STATE
- Waiting, on CPU
- Based on WAIT_TIME
- WAIT_TIME (v$session, v$session_wait, v$ash)
- 0 => waiting
- >0 => CPU (value is time of last wait)
- TIME_WAITED
- Actual time waited for event
- 0 until wait finishes
- Fix up values (no one else can do this)


