InterBase Performance Monitor Window
Go Up to IBConsole Windows and Tools
IBConsole contains a tool called InterBase Performance Monitor that lets you monitor the performance of databases. To open InterBase Performance Monitor, select a connected database and choose Database > Performance Monitor.... You can also perform server wide monitoring. To open InterBase server wide Performance Monitor, right click on a listed server and select Server Performance Monitoring.
This page describes the structure of the InterBase Performance Monitor. For more details on how to use the performance monitor to analyze the performance of a database, see Using InterBase Performance Monitor.
Contents
InterBase Performance Monitor Menus and Dialogs
InterBase Performance Monitor offers the following menus:
InterBase Performance Monitor offers the following dialogs:
Monitor Menu
- 10 Second Refresh: Sets the refresh frequency of the InterBase Performance Monitor to 10 seconds.
- 30 Second Refresh: Sets the refresh frequency of the InterBase Performance Monitor to 30 seconds.
- 60 Second Refresh: Sets the refresh frequency of the InterBase Performance Monitor to 60 seconds.
- Paused: (
CTRL+P) Pauses the execution of the InterBase Performance Monitor. - Refresh: (
F5) Manually refresh the state of the InterBase Performance Monitor. - Memory:
- Save As...: (
CTRL+S) Opens the Export dialog that allows you to export the content of the current tab. - Show Fields...: Opens the Visible Columns dialog for the current tab.
- Show Performance Monitor Data: Shows the data that the InterBase Performance Monitor itself produces (the connections, transactions, etc. ) in the InterBase Performance Monitor.
- Show System Tables: Shows the data for system tables and system temporary tables in the InterBase Performance Monitor.
Logging Menu
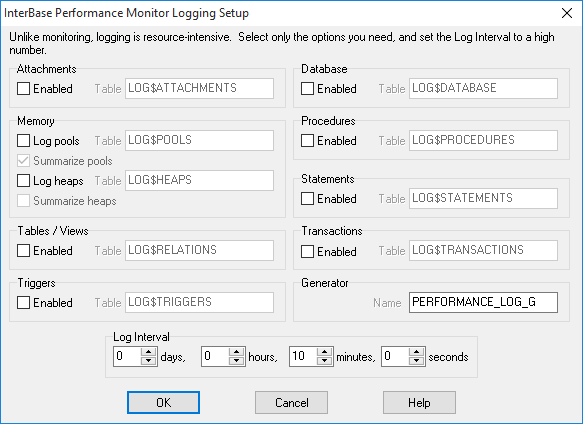
- Setup Logging: Opens the InterBase Performance Monitor Logging Setup dialog.
- Logging:
- Log Visualization:
Tools Menu
- View Database Statistics...: Opens the Database Statistics dialog.
- View interbase.log...: Displays the contents of the interbase.log file in an Text Viewer window.
Help Menu
- Contents: (
F1) Open the context-sensitive help.
Windows Menu
Opens the Active Windows dialog.
Export Dialog
You can export the contents of any tab. To do that, do one of the following:
- Select Monitor > Save As....
- Use the Save As button on the toolbar.
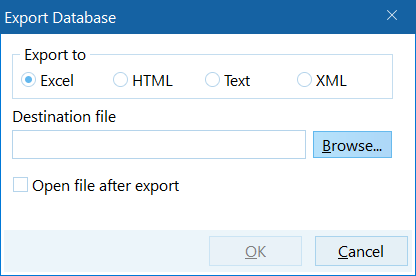
The image below shows an example of the Export dialog:
All of the export dialogs are the same (except for the name of the dialog). They offer the following options:
- Export to: The format that you want to export the data to. Available options are: Excel, HTML, Text, XML.
- Destination file: The path of the file to be exported. You can use the Browse button to search for a location.
- Browse: Search for a location where the file is exported.
- Open file after export: Mark this check box if you want the exported file to open automatically after the export is finished.
Visible Columns Dialog
Some tabs allow you to select the data that the tab shows in the table. To do that select Monitor > Show Fields....
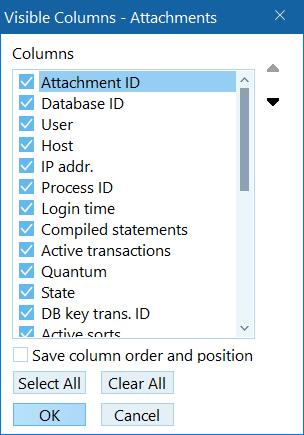
The image below shows an example of the Visible Columns dialog:
Use the check boxes to select the items that you wish to see in that tab.
If you want to make any changes persistent, select the Save column order and position check box. Otherwise, the column position and order is reset everytime you close the InterBase Performance Monitor.
Database Statistics Dialog
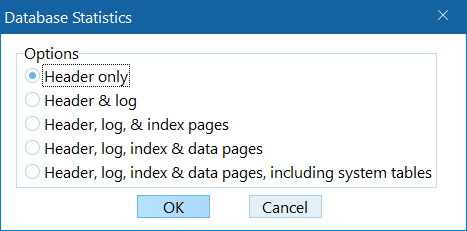
The database statistics dialog lets you choose which statistics you wish to see. When you select the desired option and click OK, the information displays in an Text Viewer window. To access this dialog go to Tools > View Database Statistics..
InterBase Performance Monitor Logging Setup Dialog
InterBase Performance Monitor Tabs
The information that the InterBase Performance Monitor shows are organized in several tabs. Each of the tabs has a toolbar that allows you to perform different actions. Some tabs show the information in a form of a table. You can click on any of the table columns to sort the table by that column. You can drag columns to reorder them.
Terminology
You may find some term that you may not be familiar with in the InterBase Performance Monitor. The table below explains some of those terms:
| Term | Description |
|---|---|
| Clone number | InterBase may keep more than one copy of a stored procedure or a trigger in memory. Two or more copies of the same procedure are called clones. The clone number distinguishes two copies of the same procedure and is needed to uniquely identify a record in TMP$PROCEDURES or TMP$TRIGGERS.
|
| GC | Short for garbage collector. The garbage collector in InterBase disposes of obsolete record versions. Obsolete record versions are those that are not visible to any active transaction. |
| GC backouts | Occur when a transaction is rolled back. If a record version that the rollback created is encountered, it is marked for garbage collection and the prior (committed) version of the record is brought forward into the primary slot on the data page. |
| GC expunges | Occur when a record which is not visible to any active transaction is deleted and the deleting transaction commits. The deleted record and all prior committed versions of that record are removed so that the disk space can be reused. If the record is still visible to older snapshot transactions, the expunge cannot happen until after those transactions end. |
| GC purges | This occurs when the garbage collector removes old versions of a record which are no longer needed by any active transaction. |
| Page fetches | A page fetch is any reference to a database page (regardelss if the page is read from the page cache or from disk). |
| Page marks | A mark occurs whenever a page is about to be modified. The mark lets the cache manager know that the page should eventually be written to disk. |
| Page reads | A page read occurs when the page is read from the disk (because it cannot be found in the page cache - buffer). |
| Page writes | A page write occurs when the page is written to disk. |
| Quantum | Quantum is a measure of how much work the server has to do to complete a request. The work may be CPU cycles, HDD reads, etc. The higher the quantum the bigger the load on the server. |
| Request | The internal, compiled version of a query. |
Attachment Tab
The attachment tab shows a table with details about the attachments that correspond to this database.
| Column Group | Column | Description |
|---|---|---|
| User | Attachment ID | The ID number of the attachment. |
| User | The user name associated with the attachment. | |
| Host | The host name associated with the attachment. | |
| IP addr. | The IP address associated with the attachment. | |
| Process ID | The ID of the process associated with the attachment. | |
| Login time | The time stamp of the connection established associated with the attachment. | |
| Compiled statements | The number of compiled statements associated with the attachment. | |
| Active transactions | The number of active transactions associated with the attachment. | |
| Quantum | The load on the server associated with the attachment. | |
| State | The current state of the attachment. Possible values are: CONNECTED, ACTIVE. | |
| DB key trans. ID | The transaction ID of dbkey. | |
| Active sorts | The number of active sorts. | |
| Records | Deletes | The number of DELETE operations associated with the attachment.
|
| Inserts | The number of INSERT operations associated with the attachment.
| |
| Selects | The number of SELECT operations associated with the attachment.
| |
| Updates | The number of UPDATE operations associated with the attachment.
| |
| GC backouts | The number of GC backouts associated with the attachment. | |
| GC expunges | The number of GC expunges associated with the attachment. | |
| GC purges | The number of GC purges associated with the attachment. | |
| Pages | Fetches | The number of pages fetched associated with the attachment. |
| Marks | The number of pages marked associated with the attachment. | |
| Reads | The number of reads performed associated with the attachment. | |
| Writes | The number of writes performed associated with the attachment. |
Attachment Tab Toolbar
The Attachment Tab toolbar offers the following buttons:
- Cancel Current Operation: Allows you to stop all work for selected attachments. If you use the Cancel Current Operation button, the InterBase Performance Monitor shows a Confirm dialog before canceling the operation. This action does not disconnect the selected attachments.
- Ping Selected: Pings selected attachments to make sure that they are connected to an active client application.
- Ping All Attachments: Pings all attachments to make sure that they are connected to an active client application.
- Shutdown: Disconnects selected attachments from the server.
- Save As...: Opens the Export dialog for this tab.
Database Tab
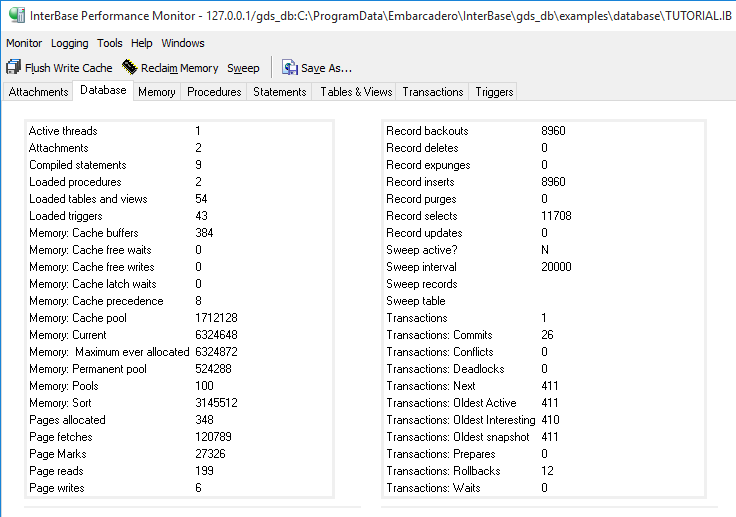
The database tab shows details about the database.
| Item | Description |
|---|---|
| Active threads | The number of active threads for this database. |
| Attachments | The number of attachments for this database. |
| Compiled statements | The number of compiled statements for this database. |
| Loaded procedures | The number of loaded procedures for this database. |
| Loaded tables and views | The number of loaded tables and views for this database. |
| Loaded triggers | The number of loaded triggers for this database. |
| Memory: Cache buffers | The number of cache buffers for this database. |
| Memory: Cache free waits | The number of cache free waits for this database. |
| Memory: Cache free writes | The number of cache free writes for this database. |
| Memory: Cache latch waits | The number of cache latch for this database. |
| Memory: Cache precedence | The number of cache precedence for this database. |
| Memory: Cache pool | The size of the cache pool for this database. |
| Memory: Current | The size of the currently allocated memory for this database. |
| Memory: Maximum ever allocated | The maximum size of the allocated memory for this database. |
| Memory: Permanent pool | The size of the permanent memory pool for this database. |
| Memory: Pools | The current size of the memory pool for this database. |
| Memory: Sort | The size of the sort memory for this database. |
| Pages allocated | The number of pages allocated for this database. |
| Page fetches | The number of pages fetched for this database. |
| Page Marks | The number of pages marked for this database. |
| Page reads | The number of read operations for this database. |
| Page writes | The number of write operations for this database. |
| Item | Description |
|---|---|
| Record backouts | The number of record backouts for this database. |
| Record deletes | The number of records deleted for this database. |
| Record expunges | The number of record expunges for this database. |
| Record inserts | The number of records inserted for this database. |
| Record purges | The number of record purges for this database. |
| Record selects | The number of records selected for this database. |
| Record updates | The number of records updated for this database. |
| Sweep active? | Indicates whether there is a sweep currently active. Possible values are N (no) and Y (yes). |
| Sweep interval | The sweep interval for this database. |
| Sweep records | Records swept |
| Sweep table | ?? |
| Transactions | The number of transactions for this database. |
| Transactions: Commits | The number of transaction commits for this database. |
| Transactions: Conflicts | The number of transaction conflicts for this database. |
| Transactions: Deadlocks | The number of transaction deadlocks for this database. |
| Transactions: Next | The next transaction number |
| Transactions: Oldest Active | The oldest active transaction |
| Transactions: Oldest Interesting | The oldest interesting transaction |
| Transactions: Oldest snapshot | Oldest snapshot transaction |
| Transactions: Prepares | The number of transaction prepares |
| Transactions: Rollbacks | The number of transaction rollbacks for this database. |
| Transactions: Waits | The Number of transaction waits |
Database Tab Toolbar
The Database Tab toolbar offers the following buttons:
- Flush Write Cache: Forces the server to write all cached changes to disk. This option has no effect if forced writes are turned on.
- Reclaim Memory: Instructs the server to reclaim the memory that is assigned to unused heaps or cloned copies of stored procedures and triggers.
- Sweep: Triggers a database sweep.
- Save As...: Opens the Export dialog for this tab.
Indices Tab
The Indices tab shows a table with details about indices.
| Column Group | Column | Description |
|---|---|---|
| Index Information | Relation | The relation name. |
| Index Name | The index name | |
| Type | Index Type; types include PRIMARY KEY, FOREIGN KEY, UNIQUE, NON-UNIQUE, EXPRESSION
| |
| Segments | The number of segments/columns in the index definition. | |
| Keysize | The maximum index key size allowed in the index. | |
| Pages | Depth | Depth of the index B-tree structure. Larger the depth, more the time taken to fetch a record. Consider increasing database page size to reduce depth. |
| Invocations | Number of requests that have used this index for retrieval. | |
| Reads | Not used, yet. | |
| Writes | Number of index page/buckets that have been written to | |
| Fetches | Number of index page/buckets that have been fetched | |
| Splits | Number of index page/buckets that have been split to accommodate a new index node insertion. | |
| Reverse Splits | Number of times 2 less-populated index page/buckets have been combined. | |
| Navigations | Number of index page/buckets that have been read for a navigation request; ORDER BY
| |
| Records | Inserts | Number of new index nodes inserted |
| Updates | Number of index nodes updated; updates are a combination of 1 delete (of old key) and 1 insert (of new key) | |
| Deletes | Number of index nodes deleted; sometimes reflect a negative number if update related delete node have not been garbage collected yet | |
| Nodes | Node Walks | Number of index nodes traversed in total, in all levels (depth); include nonleaf (pointer pages) and leaf (record nodes) page nodes. |
| Non Leaf Walks | Number of nonleaf index page nodes traversed/walked. | |
| Leaf Walks | Number of leaf index page nodes traversed/walked | |
| Equality Matches | Number of index nodes/records retrieved for an equality match; "a = b", JOIN, IN list, etc.
| |
| Range Matches | Number of index nodes/records retrieved for a range retrieval; BETWEEN, "a > b", etc.
|
Indices Tab Toolbar
The Indices Tab toolbar offers the following button:
- Save As...: Opens the Export dialog for this tab.
Memory Tab
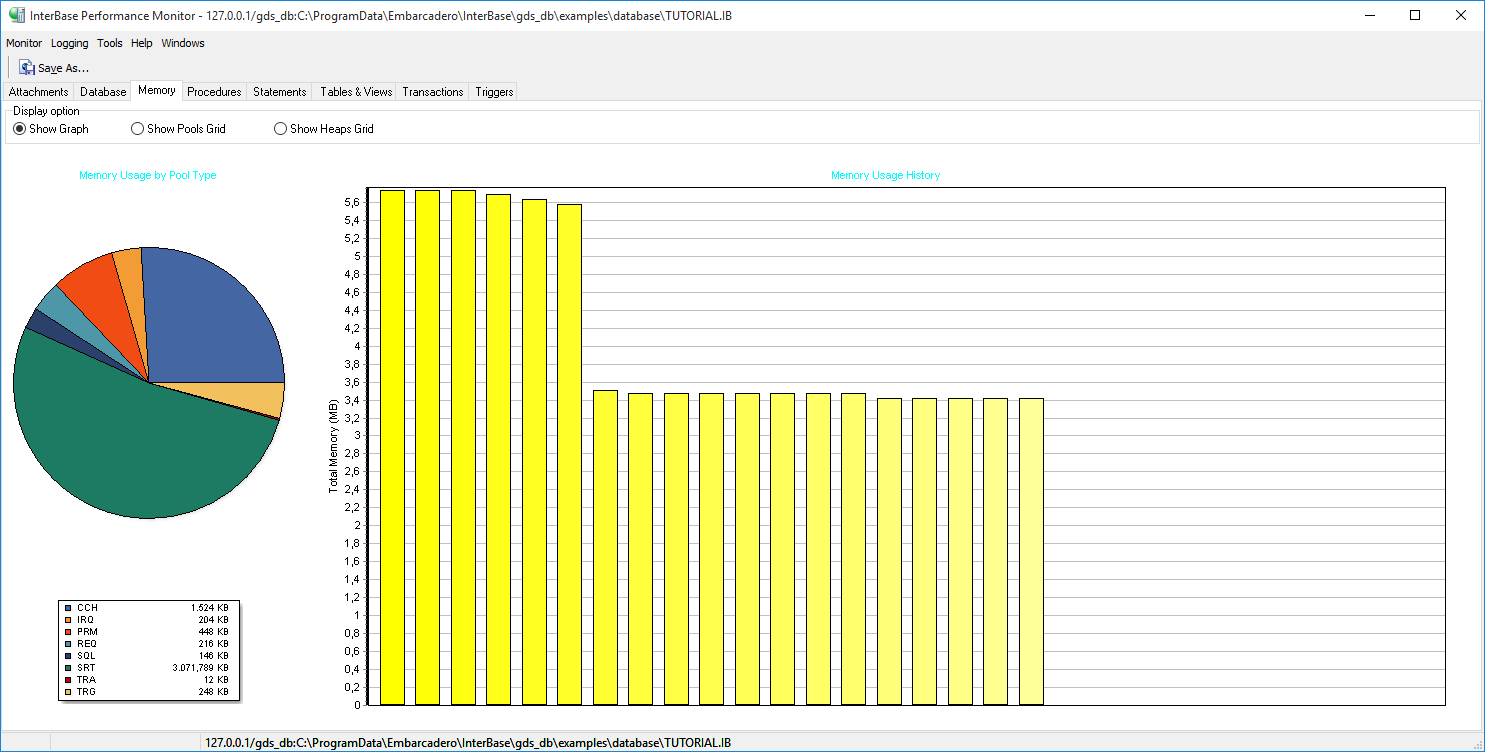
The memory tab shows details about the memory usage for this database. You can view the information in three different ways.
You may see the following types of memory pools on the chart or grid:
| Memory Type | Description |
|---|---|
| CCH | Memory pool from which cache manager data structures are allocated. The major memory allocation is for the page buffers. |
| DYN | Internal request pools specifically having to do with data definition (DDL) operations. |
| IRQ | Registry of persistent internal requests. InterBase executes internal requests against system tables to maintain and load the metadata of a database. |
| PRM | Permanent pool from which internal metadata structures are allocated. |
| REQ | Request blocks. Normal user queries which are compiled into executable requests. |
| SQL | SQL statements (un-compiled user queries). |
| SRT | Sort memory blocks. These are used when InterBase must sort a result set in memory.
|
| TRA | Transaction manager. Transaction pools allocate data structures having to do with a transaction such as save points and transaction bitmaps for concurrency control. |
| TRG | Trigger pool from which a trigger request is allocated. |
Use the Display option setting to switch between different view modes:
- Show Graph: Display a pie chart of memory usage by memory type and a graph of total memory usage on a timeline. If you select this option, the view is constantly updated (even if you switch to another tab). In order to reduce the load on the server, select one of the grid display options.
- Show Pools Grid: Display a table of memory usage:
Column Group Column Description Type The type of the memory. Pools The number of pools associated with the memory type. Total Total memory allocated to the memory type. Free Total free memory for the memory type. Extended amt. The amount of memory that this pool extends to if the server needs more memory. Free stack nodes ?? Free bitmap buckets ?? Free bitmap segments ?? - Show Heaps Grid: Display a table of memory usage by heaps. The table shows the physical address and the free memory of each heap and groups data by type of heap (RANDOM or BLOCK). This is a very low level view of the memory allocations of InterBase.
Memory Tab Toolbar
The Memory Tab toolbar offers the following buttons:
- Save As...: Opens the Export dialog for this tab.
Procedures Tab
The procedures tab shows a table with details about the procedures that correspond to this database.
| Column Group | Column | Description |
|---|---|---|
| Procedure | Procedure Name | The name of the procedure. |
| Clone nc | The clone number of the procedure. | |
| Start time | The timestap of the execution of the procedure. | |
| Statements | The number of statements in the procedure. | |
| Quantum | The load on the server associated with the procedure. | |
| Calls | ?? | |
| Memory | Memory | The memory allocated for this procedure. |
| Records | Deletes | The number of DELETE operations associated with the procedure.
|
| Inserts | The number of INSERT operations associated with the procedure.
| |
| Selects | The number of SELECT operations associated with the procedure.
| |
| Updates | The number of UPDATE operations associated with the procedure.
| |
| GC backouts | The number of GC backouts associated with the procedure. | |
| GC expunges | The number of GC expunges associated with the procedure. | |
| GC purges | The number of GC purges associated with the procedure. | |
| Pages | Fetches | The number of pages fetched associated with the procedure. |
| Marks | The number of pages marked associated with the procedure. | |
| Reads | The number of read operations for this procedure. | |
| Writes | The number of write operations for this procedure. |
Procedures Tab Toolbar
The Procedures Tab toolbar offers the following buttons:
- Save As...: Opens the Export dialog for this tab.
Statements Tab
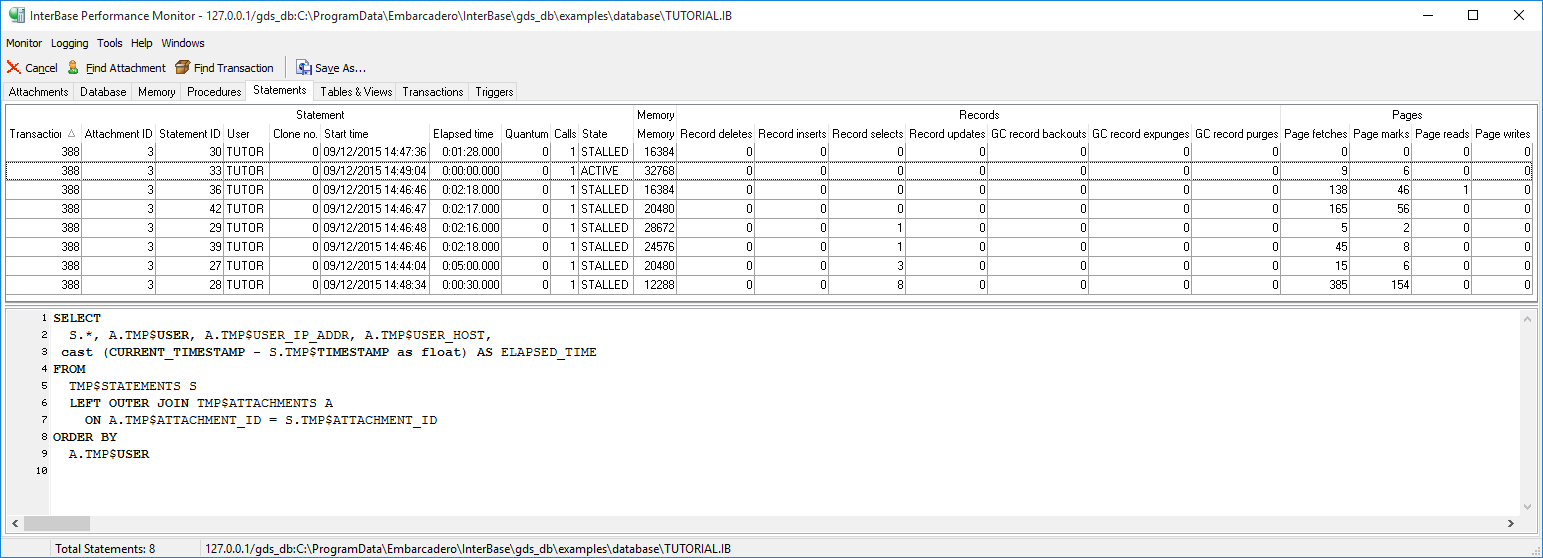
The statement tab shows a table with details about the statements that correspond to this database. The bottom part of the tab shows the metadata definition for the selected statement.
| Column Group | Column | Description |
|---|---|---|
| Statement | Transaction ID | The ID number of the transaction associated with the statement. |
| Attachment ID | The ID number of the attachment associated with the statement. | |
| Statement ID | The ID number of the statement. | |
| User | The user name associated with the statement. | |
| Clone no. | The clone number of the statement. | |
| Start time | The time stamp of the execution of the statement. | |
| Elapsed time | The elapsed time for the execution of the statement. | |
| Quantum | The load on the server associated with the statement. | |
| Calls | The number of calls associated with the statement. | |
| State | The current state of the statement. Possible values are ACTIVE, INACTIVE, STALLED, and CANCELLED. STALLED means that the statement has executed but the client has not fetched all rows yet. The server is waiting for the client to fetch the rest of the rows. | |
| Memory | Memory | The allocated memory for the statement. |
| Records | Record deletes | The number of DELETE operations associated with the statement.
|
| Record inserts | The number of INSERT operations associated with the statement.
| |
| Record selects | The number of SELECT operations associated with the statement.
| |
| Record updates | The number of UPDATE operations associated with the statement.
| |
| GC record backouts | The number of GC backouts associated with the statement. | |
| GC record expunges | The number of GC expunges associated with the statement. | |
| GC record purges | The number of GC purges associated with the statement. | |
| Pages | Page fetches | The number of pages fetched associated with the statement. |
| Page marks | The number of pages marked associated with the statement. | |
| Page reads | The number of read operations for this statement. | |
| Page writes | The number of write operations for this statement. |
Statements Tab Toolbar
The Statements Tab toolbar offers the following buttons:
- Cancel: Cancels the selected statements. Only available for ACTIVE or STALLED statements.
- Find Attachment: Locates the attachment associated with the statement. This takes you to the Attachments tab and selects the corresponding attachment.
- Find Transaction: Locates the transaction associated with the statement. This takes you to the Transactions tab and selects the corresponding transaction.
- Save As...: Opens the Export dialog for this tab.
Tables & Views Tab
The tables & views tab shows a table with details about the tables and views that correspond to this database. Use the Show System Tables option in the Monitor menu to include/exclude information about system tables and temporary tables.
| Column Group | Column | Description |
|---|---|---|
| Table / View | Name | The name of the table. |
| Statements using | The number of statements that use the table. | |
| Pointer pages | The number of pointer pages for the table. | |
| Formats | Keeps track of the format versions of the columns in a table. | |
| Sequential scans | The number of Sequential Scans | |
| Sweep count | The number of times the table has been swept. | |
| Records | Indexed selects | The number of indexed selects. |
| Sequential selects | The number of sequential selects | |
| Deletes | The number of DELETE operations associated with the table.
| |
| Inserts | The number of INSERT operations associated with the table.
| |
| Updates | The number of UPDATE operations associated with the table.
| |
| GC backouts | The number of GC backouts associated with the table. | |
| GC expunges | The number of GC expunges associated with the table. | |
| GC purges | The number of GC purges associated with the table. | |
| Pages | Data | ?? |
| Fetches | The number of pages fetched associated with the table. | |
| Reads | The number of read operations for this table. | |
| Marks | The number of pages marked associated with the table. | |
| To GC | ?? | |
| Writes | The number of read operations for this table. |
Tables & Views Tab Toolbar
The Tables & Views Tab toolbar offers the following buttons:
- Save As...: Opens the Export dialog for this tab.
Transactions Tab
The transactions tab shows a table with details about the transactions that correspond to this database.
| Column Group | Column | Description |
|---|---|---|
| Transaction | Attachment ID | The ID number of the attachment associated with the transaction. |
| Transaction ID | The ID number of the transaction. | |
| User | The user name associated with the transaction. | |
| State | The state of the transaction. Possible values are ACTIVE, INACTIVE. | |
| Start time | The time stamp of the start of the transaction. | |
| Elapsed time | The time elapsed since the start of the transaction. | |
| Commit retaining | Commit retaining performed | |
| Isolation | ?? | |
| Read only | Indicates whether the transaction is read-only. | |
| Snapshot no. | Snapshot transaction number | |
| No wait | Transaction is no wait | |
| Quantum | The load on the server associated with the transaction. | |
| Savepoint records | Savepoint number of records | |
| Data writer | ?? | |
| Memory | Active sorts | Number of active sorts |
| Records | Deletes | The number of DELETE operations associated with the transaction.
|
| Inserts | The number of INSERT operations associated with the transaction.
| |
| Selects | The number of SELECT operations associated with the transaction.
| |
| Updates | The number of UPDATE operations associated with the transaction.
| |
| GC backouts | The number of GC backouts associated with the transaction. | |
| GC expunges | The number of GC expunges associated with the transaction. | |
| GC purges | The number of GC purges associated with the transaction. | |
| Pages | Fetches | The number of pages fetched associated with the transaction. |
| Marks | The number of pages marked associated with the transaction. | |
| Reads | The number of read operations for this transaction. | |
| Writes | The number of write operations for this transaction. |
Transactions Tab Toolbar
The Transactions Tab toolbar offers the following buttons:
- Commits: Commits the selected transactions. Only for ACTIVE transactions.
- Rollback: Rollbacks the selected transactions. Only for ACTIVE transactions.
- Find Attachment: Locates the attachment associated with the statement. This takes you to the Attachments tab and selects the corresponding attachment.
- Save As...: Opens the Export dialog for this tab.
Triggers Tab
The triggers tab shows a table with details about the triggers that correspond to this database.
| Column Group | Column | Description |
|---|---|---|
| Trigger | Table / View Name | The name of the table or view associated with this trigger. |
| Trigger Name | The name of the trigger. | |
| Clone | The clone number of the trigger. | |
| Sequence | Sequence number for the trigger being defined | |
| Order | The trigger order. Possible values are BEFORE and AFTER. | |
| Operation | The trigger operation. Possible values are UPDATE, DELETE and INSERT. | |
| Timestamp | The time stamp of the latest trigger execution. | |
| Quantum | The load on the server associated with the trigger. | |
| Invocations | The number of trigger executions. | |
| Pool | Memory | The memory allocated for this trigger. |
| Records | Selects | The number of SELECT operations associated with the trigger.
|
| Inserts | The number of INSERT operations associated with the trigger.
| |
| Updates | The number of UPDATE operations associated with the trigger.
| |
| Deletes | The number of DELETE operations associated with the trigger.
| |
| Purges | The number of purges associated with the trigger. | |
| Expunges | The number of expunges associated with the trigger. | |
| Backouts | The number of backouts associated with the trigger. | |
| Pages | Reads | The number of read operations for this trigger. |
| Writes | The number of read operations for this trigger. | |
| Fetches | The number of pages fetched associated with the trigger. | |
| Marks | The number of pages marked associated with the trigger. |
Triggers Tab Toolbar
The Triggers Tab toolbar offers the following buttons:
- Save As...: Opens the Export dialog for this tab.
