Registers Pane
Go Up to CPU Windows Index
View > Debug Windows > CPU Windows > Registers
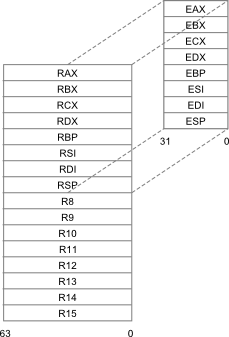
This pane displays the contents of the CPU registers of the 80386 and greater processors. These registers consist of eight 32-bit general purpose registers, the 32-bit program counter (EIP), the flags (EFL) register, and the six segment registers.
The Registers pane is the upper middle pane of the CPU windows when the Entire CPU view is displayed (View > Debug Windows > CPU Windows > Entire CPU).
After you execute an instruction, any registers that have changed value since the program was last paused are highlighted in red.
| Item | Description |
|---|---|
|
Increment Register |
Adds 1 to the value in the currently highlighted register. This option lets you test "off-by-one” bugs by making small adjustments to the register values. |
|
Decrement Register |
Subtracts 1 from the value in the currently highlighted register. This option lets you test “off-by-one” bugs by making small adjustments to the register values. |
|
Zero Register |
Sets the value of the currently highlighted register to 0. |
|
Change Register |
Displays the Change Register dialog box where you enter a new value for the register. You can make full use of the expression evaluator to enter new values. Be sure to precede hexadecimal values with $ (dollar sign). |
|
Follow |
Positions the pane at the destination address of the instruction currently highlighted. The Follow commands appear only in the Entire CPU view, not in the standalone Registers pane. The Follow commands are disabled if the selected register is EFL or any of the 16-bit segment registers.
|
|
Copy |
Copies the selected data to the clipboard. |
|
View FPU |
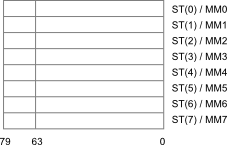
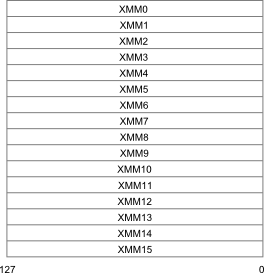
Displays the FPU view, which displays the floating-point registers, MMX registers, and SSE registers. |
Figures: x64 CPU General Purpose Registers, x86 FPU Data Registers, and x64 SSE Data Registers


