Viewing Charts and Reports on Collections
Go Up to Using Capacity Analyst
The preliminary steps in setting up Capacity Analyst are Creating and Editing Collections and Updating Statistics in Collections for use in Reports and Charts. Once your collections are defined and the statistics updated, Capacity Analysts lets you view forecasting/trends charts and reports on your collections. Key options are:
- Using the Collection Analysis Viewer - lets you view charted representations of collection metrics as a function of time.
- Working with Capacity Analyst Reports - lets you work with predefined reports that focus on growth of databases, storage mechanisms, and specific database objects, as well as failure prediction and fragmentation.
Contents
Using the Collection Analysis Viewer
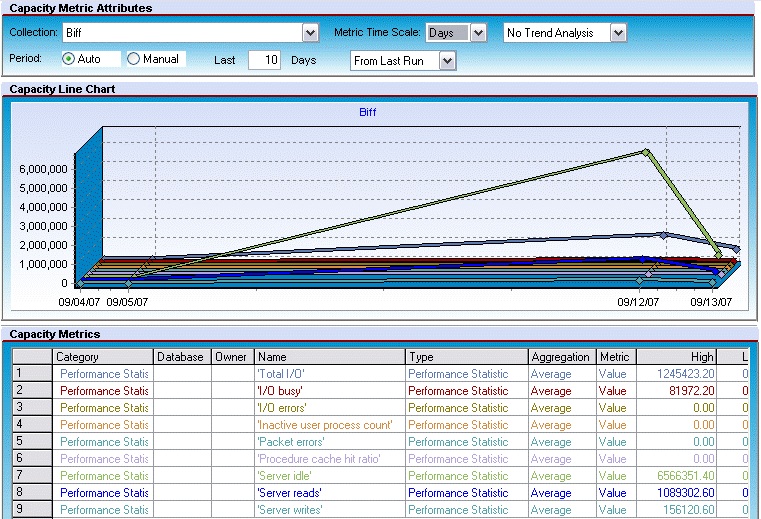
The Collection Analysis Viewer lets you perform ad hoc analysis of statistics in a collection. It presents the metrics in two formats: a graphical representation that shows values over time and a tabular format that includes metrics such as average, maximum, and minimum values.
The Collection Analysis Viewer lets you:
- View historical trends for a metric and extrapolate into the future
- Compare and contrast multiple metrics
- Vary the time scale for fine-grained or coarse-grained views
The first time that you open the Collection Analysis Viewer on a particular collection, you are prompted to select the metrics you want to view for that collection. Subsequently, when using the Collection Analysis Viewer against that collection, you can add metrics to and delete metrics from the collection.
To open the Collection Analysis Viewer on a collection
- Open the Capacity Analyst. See Opening the Capacity Analyst.
- Select a Capacity Collection. For more information, see Creating and Editing Collections.
- On the toolbar, click the Collection Analysis Viewer button.

- Note: If this is the first time you have opened this particular collection, you are prompted to specify the statistics to display. For help with this step, see Adding Metrics to the Collection Analysis Viewer for a Collection.
- Capacity Analyst opens the Collection Analysis View or the selected collection.
Viewing options available when working with the Collection Analysis Viewer include:
- Using the Delete Metric button to remove a statistic from the displayed metrics for a collection
- Using the zoom buttons on the Collection Analysis Viewer toolbar to zoom in and out on the report
- Using the refresh button on the Collection Analysis Viewer toolbar to update displayed values
- Using the Collection dropdown to open the Collection Analysis Viewer on a different collection
- Using the Metric Time Scale dropdown to choose between displayed time scales of hours, days, months, or years
- Using the trending and value dropdowns to extrapolate metric values out to specified values or specific dates
- Using the Period controls to change the date/time range displayed
- Viewing values for metrics at specific locations on the graph by floating the cursor over specific locations on the curve
Adding Metrics to the Collection Analysis Viewer for a Collection
There are two situations in which you can add metrics viewed using the Collection Analysis Viewer:
- The first time that you open the Collection Analysis Viewer for a given collection
- When you want to manually add metrics by clicking the Collection Analysis Viewer toolbar’s Add Metric button:
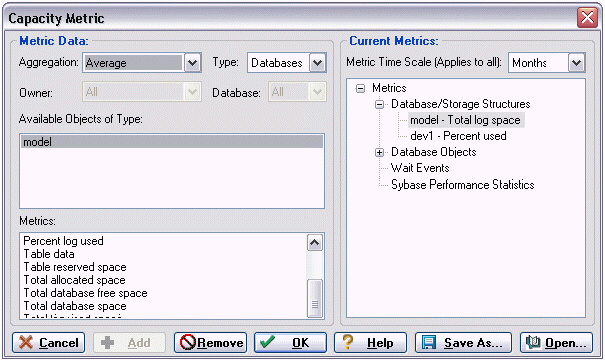
In both cases, Capacity Analyst opens a Capacity Metric dialog to let you add metrics.
For each metric you want add to the Capacity Analyst Analysis Viewer
- From the Aggregation dropdown, select an aggregation type: Average, Maximum, or Minimum.
- From the Type dropdown, select the type of metric you want to add.
- Note: Certain Metric types allow you to further qualify using the Owner and Database dropdowns.
- From the Available Object of Type list, choose a specific object or statistics type.
- The Metrics list is updated with the metrics available for the Type and Available Objects of Type selections you made.
- Select a metric from the Metrics list and click Add.
- Capacity Analyst adds the metric to the Current Metrics list.
- To add additional metrics, repeats Step 1 through Step 4.
- When finished adding metrics for the Capacity Analyst Collection Analysis Viewer, click OK.
Capacity Analyst updates the Collection Analyst Viewer with the new metrics.
Working with Capacity Analyst Reports
Capacity Analyst provides two report options. For details, see the following topics:
- Running a Capacity Collection Summary Report - lets you view a summary of the metrics and options currently defined for a collection.
- Running an Analysis Report - lets you view one of several predefined reports focusing on growth trends
Running a Capacity Collection Summary Report
You can produce a high-level summary of the content and options associated with a collection. It includes:
- Basic identification information such as the name, associated datasource, and owner of the collection
- A listing of the options, refresh and auto-purge for example, chosen for that collection
- A summary of the types of statistics available for use in the collection
- A detailed listing of the objects for which statistics are collected
- Note: For a detailed listing of the specific statistics and options available for the DBMS you are working with, see the DBMS-specific heading under Content and Options in a Collection.
To run a Capacity Collection Summary Report
- Open the Capacity Analyst. See Opening the Capacity Analyst.
- Select a Capacity Collection. For more information, see Creating and Editing Collections.
- On the Capacity Analyst toolbar, click the Report button.
- Select Capacity Collection Summary Report and click OK.
Capacity Analyst opens the summary report in a new tab.
Running an Analysis Report
Capacity Analyst lets you run a set of predefined reports against a collection. The reports and their availability by DBMS are:
- Database growth trends (Sybase ASE, SQL Server, DB2)
- Tablespace failure prediction (Oracle)
- Tablespace growth trends (DB2, Oracle)
- Device growth trends (Sybase ASE)
- Filegroup growth trends (SQL Server)
- File growth trends (SQL Server)
- Object growth trends (Sybase ASE, SQL Server, DB2, Oracle)
- Object extent trends (Sybase ASE, SQL Server)
- Object extent failure prediction
- Database backup growth trends (SQL Server)
- ‘N’ Fastest growing databases (Sybase ASE, SQL Server, DB2)
- ‘N’ Fastest growing tablespaces (Oracle)
- ‘N’ Fastest growing objects (Sybase ASE, SQL Server, DB2, Oracle)
- Table rows trend (Sybase ASE, SQL Server, DB2, Oracle)
- Table chained/migrated rows trend (Oracle)
- Table forwarded records trend (Sybase ASE, SQL Server)
- Index level trend (Oracle)
- Object fragmentation trends (Sybase ASE, SQL Server, DB2)
- Tablespace fragmentation trend (Oracle)
- Database failure prediction (Sybase ASE, SQL Server)
- DMS tablespace failure trends (Oracle)
To run an analysis report
- Open the Capacity Analyst. See Opening the Capacity Analyst.
- Select a Capacity Collection. For more information, see Creating and Editing Collections.
- On the Capacity Analyst toolbar, click the Report button.
- Select Analysis Report and click OK.
- Capacity Analyst opens the Capacity Analyst Report Wizard.
- Use the following table as a guide to understanding the settings and options for this wizard
| Panel | Tasks and settings | Description |
|---|---|---|
|
Panel 1 |
Do you wish to create a new analysis report or ‘playback’ a previously saved report definition? |
As the last step in generating a report, you are offered the option to save the report definition, for the purpose of running the report again. If you have already saved report definitions, you can use this panel to enable the Previously Saved Report option and select the existing report definition. Otherwise, to run an ad hoc report or start a new report definition, you can use the New Analysis Report option. |
|
Panel 2 |
What report would you like to create? |
Lets you select one of the predefined report types listed above. |
|
Enter the time period sample to use for the report |
Auto Entry lets you specify a number of days, months or years while Manual Entry lets you provide specific start and end dates. | |
|
Enter the time rollup to use for the report. |
Lets your report display statistics rolled up by day, month, or year. | |
|
Enter the date to use for forward predictions. |
Lets you enter a future end date that the Capacity Analyst uses to forecast. | |
|
Select options for the report. |
The options offered differ by the type of report you selected and the DBMS that DBArtisan is working with. | |
|
Panel 3 |
Include objects for report. |
Expand or collapse databases or owner lists to display specific object types and use the arrow buttons to move selected objects between the Available and Selected lists. |
|
Panel 4 |
Data will be presented in text/grid format. |
Lets you specify file name and path where the report will be stored and provide a title for the report. |
|
Save this report definition? |
Lets you save the report definition, specifying the file name and path for the definition. |
- 6. When complete, click Schedule or Execute to run the report.
When complete, the report opens in a new DBArtisan tab.
- Note: When viewing the report in DBArtisan, you can use the toolbar’s Refresh button to update values displayed.
A static, HTML version is also saved to with the file name and path you specified in the Report File Name field.

