Graphic display of query
Visual SQL Tuning (VST)
DB Optimizer 2.0 introduces a new third tab* in the SQL Tuner, the ANALYSIS tab. The ANALYSIS tab is available cross platform
- In addition to the two pre-existing tabs, the INPUT tab (previously called Overview) and OVERVIEW tab (previously called Generated cases)
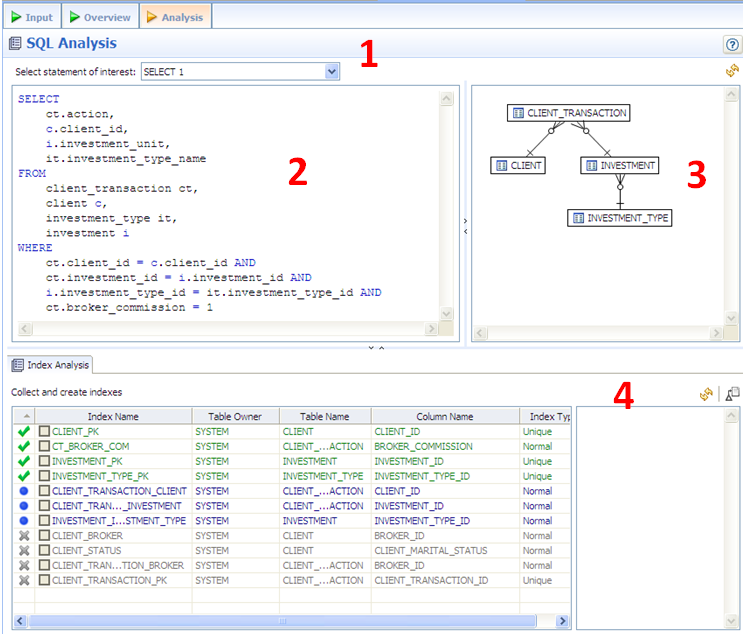
The Analysis tab has 4 important components
- 1. Statement selector (if there are multiple statements in the tuning set)
- 2. Statement text for selected statement
- 3. Graphical diagram of the SQL statement
- 4. Index analysis of the SQL statement
Each section (text, diagram ,index analysis) can be resized or expanded to take up the whole page.
Graphical Diagram
The graphical diagram is the newest and most exciting addition to DB Optimizer in 2.0. DB Optimizer 2.0 will parse a SQL query and analyze the indexes and constraints on the tables in the query and display the query graphically such that
- Tables will be represented as nodes with the table name, table alias and optionally the schema
- Joins will be represented with connecting lines between nodes
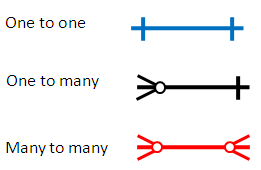
- 1 to 1 join relationships will be graphed horizontally using blue lines
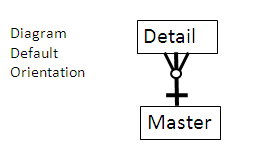
- 1 to many joins will be graphed with the many table above the 1 table.
- Many to many joins will be connected by a red line and the relative location will be not be restricted
- Nodes can be repositioned by the user (unrestricted), just click and drag
- The user will be able to zoom in and out on the diagram
- The diagram will have a compact mode displaying only table/view names and a detail mode showing indexes and fields
- Join connectors will have fly over help displaying the join text from the query
- Clicking on a join will highlight the fields in that join
- Clicking on an index will highlight the fields in that index
Detail verses Compact Mode
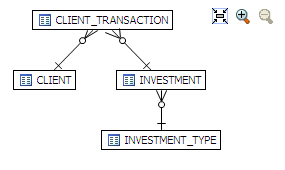
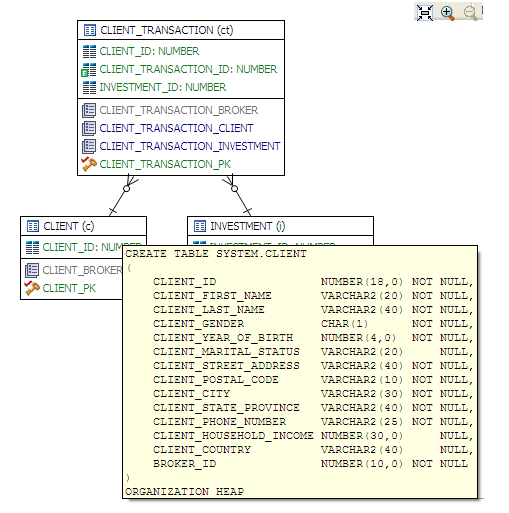
By default the diagram is displayed in compact mode just showing the table names and connectors, for example on the following page
The Visual SQL Tuning diagram looks like
but by hitting the expand all
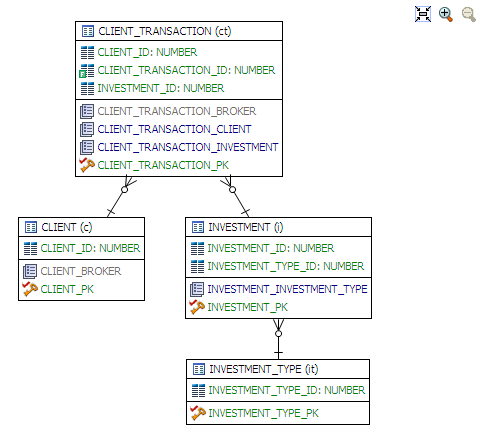
icon, then the details of the tables will be shown including fields of the table and indexes on the table:
Any particular table can be expanded or compacted by double clicking on the table/view name. Only fields that are used in the where clause are displayed in the detailed mode, but all the fields in the table can be seen by hovering the mouse over the table and flyover help will be displayed showing all the fields in the table.
Join Information Highlighted
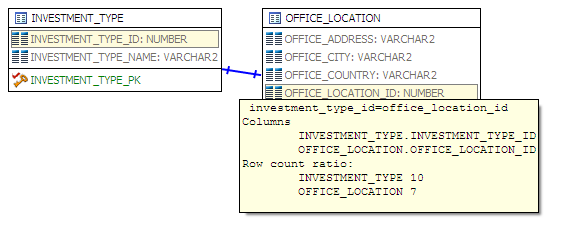
When clicking on the connector line the fields in the join will be highlighted and the actual join details will be displayed in popup text:
Index Information Highlighted
Clicking on an index will highlight the field(s) in that index
Understanding the Diagram
The diagram has a specific layout. There are 3 types of join connectors:
One-to-One
If we joined two tables on their primary key (this doesn't make much sense in this case):
- SELECT COUNT (*)
- FROM
- investment_type it,
- office_location ol
WHERE investment_type_id = office_location_id;
Then graphically these would be laid out side by side with a one to one connector:
One-to-Many
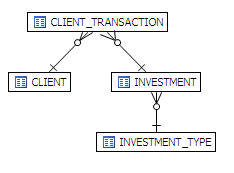
Here is an example of a query that consists of only many-to-one joins, which is much more typical:
- SELECT
- ct.action,
- c.client_id,
- i.investment_unit,
- it.investment_type_name
- FROM
- client_transaction ct,
- client c,
- investment_type it,
- investment i
- WHERE
- ct.client_id = c.client_id AND
- ct.investment_id = i.investment_id AND
- i.investment_type_id = it.investment_type_id and
- client_transaction_id=1
Cartesian Join
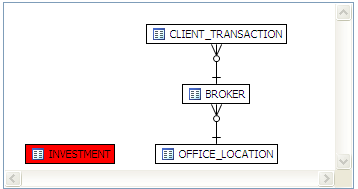
For example this query is missing join criteria on the table INVESTMENTS:
- SELECT
- A.BROKER_ID BROKER_ID,
- A.BROKER_LAST_NAME BROKER_LAST_NAME,
- A.BROKER_FIRST_NAME BROKER_FIRST_NAME,
- A.YEARS_WITH_FIRM YEARS_WITH_FIRM,
- C.OFFICE_NAME OFFICE_NAME,
- SUM (B.BROKER_COMMISSION) TOTAL_COMMISSIONS
- FROM
- BROKER A,
- CLIENT_TRANSACTION B,
- OFFICE_LOCATION C,
- INVESTMENT I
- WHERE
- A.BROKER_ID = B.BROKER_ID AND
- A.OFFICE_LOCATION_ID = C.OFFICE_LOCATION_ID
- GROUP BY
- A.BROKER_ID,
- A.BROKER_LAST_NAME,
- A.BROKER_FIRST_NAME,
- A.YEARS_WITH_FIRM,
- C.OFFICE_NAME;
And graphically this looks like:
We can see that INVESTMENTS is highlighted in red with no connectors to indicate that it is joined in via a Cartesian join. Suggestions possibile missing join condtions will be suggested in the Overview Tab.
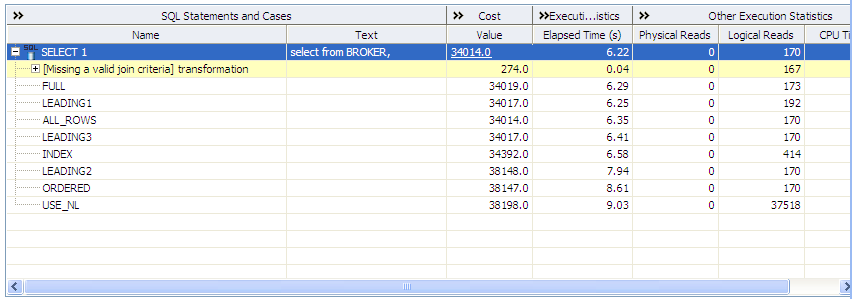
under Generated cases under transformations:
Many-to-Many
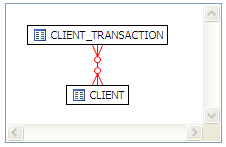
If there is no unique index or unique constraint at either end of a join then we can only assume that in some or all cases the join is many-to-many (there is no constraints preventing a many to many). For example take this query
- select *
- from client_transaction ct,
- client c
- where ct.transaction_status=c.client_marital_status;
- from client_transaction ct,
There is no unique index on either of the fields being joined so for all the optimizer knows this is a many to many join and is displayed graphically as:
Now if one of the fields is unique then the index should definitely be declared unique to help the optimizer
Implied Cartesian Join
If there are different details for a master without other criteria then it creates a Cartesian type join:
- select * from
- investment i,
- broker b,
- client c
- where b.manager_id=c.client_id and
- i.investment_type_id=c.client_id;
The result set of BROKER to CLIENT will be multiplied by the result set of INVESTMENT to CLIENT.
Index Analysis
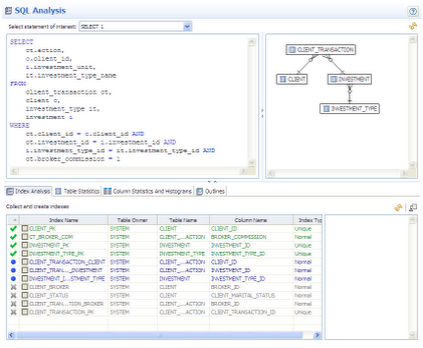
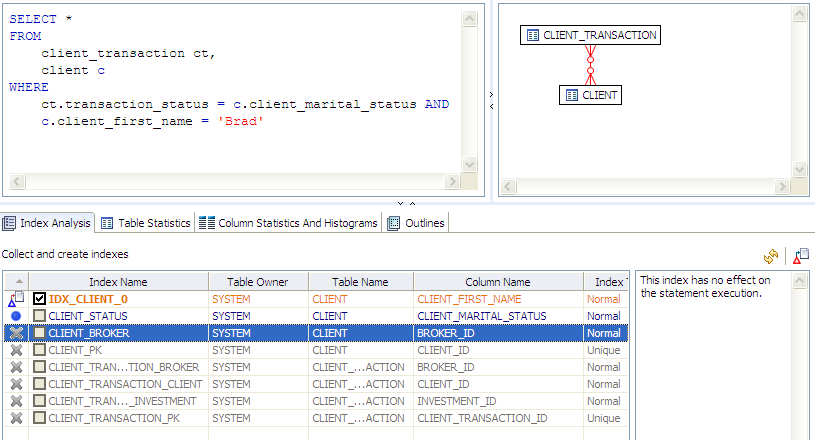
The layout of SQL Analysis shows the SQL Text and SQL Diagram on the top and the indexes on the tables below. (green = used by optimizer, blue = not used but usable, orange = recommended to create, grey = not usable in the query as written)
Indexes on the table are listed below the fields and color coded
- Green=used in the query
- Blue = usable but not used by optimizer in this case
- Orange = suggest to create
- Grey = exist on table but not usable in this query as it is written
Missing Index
- SELECT *
- FROM
- client_transaction ct,
- client c
- WHERE
- ct.transaction_status = c.client_marital_status AND
- c.client_first_name = 'Brad'
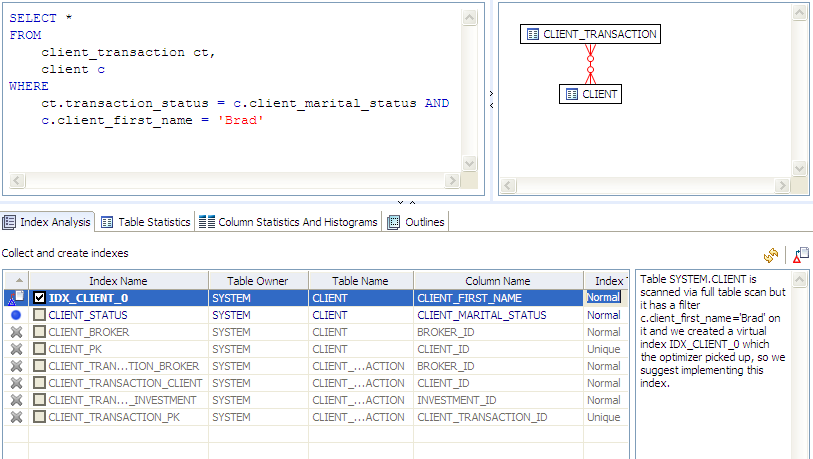
There is no index on CLIENT.CLIENT_FIRST_NAME and there are 5600 records in CLIENT, so DB Optimizer proposes creating and index:
The orange indicates that this is a missing index that we recommend to improve performance. Clicking on that index will give information on the rational to the right:
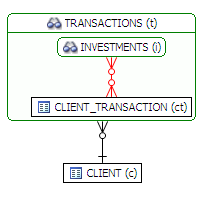
View Expansion
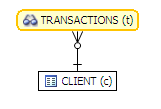
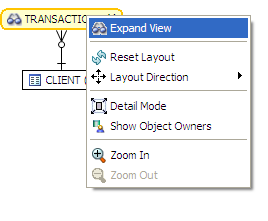
If there are views in the Visual SQL Tuning diagram, the can be expanded by right clicking on the view header and choosing "expand view":
Default layout from query join table CLIENT to view TRANSACTIONS:
Right click on the diagram and choose “Expand View”
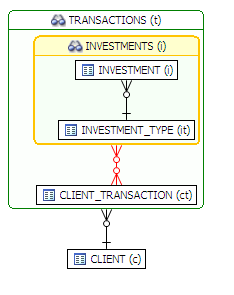
Now we see the objects in the view:
We can further expand the sub-view within the original view:
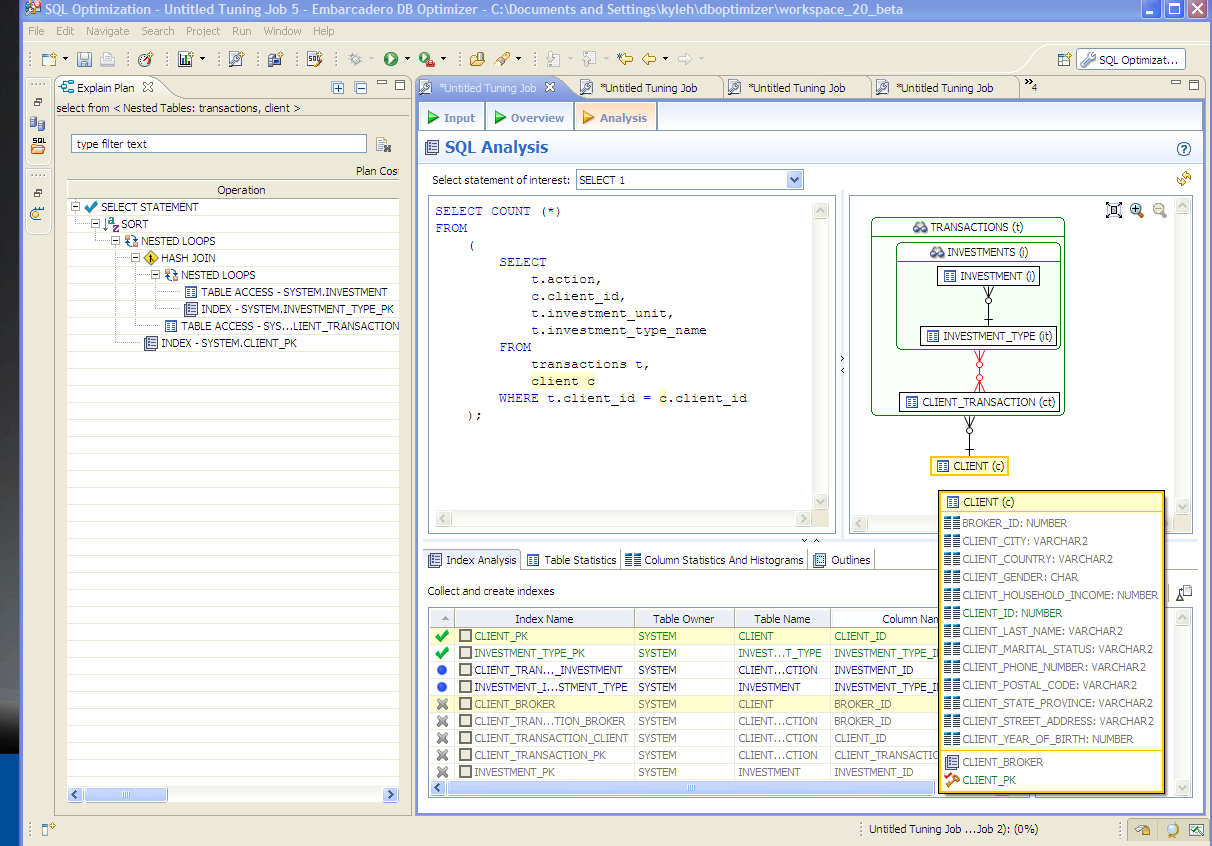
Here is an example of view expansion along with the explain plan to the left. Notice in the view expansion we also list the indexes on all the underlying tables in the views and sub views and which of those indexes is used in the default execution plan.
