User I/O
Contents
Oracle: IO Waits
other
   Datapump dump file I/O
   dbms_file_transfer I/O
   DG Broker configuration file I/O
   Log file init write
   buffer read retry
   BFILE read
   db file single write
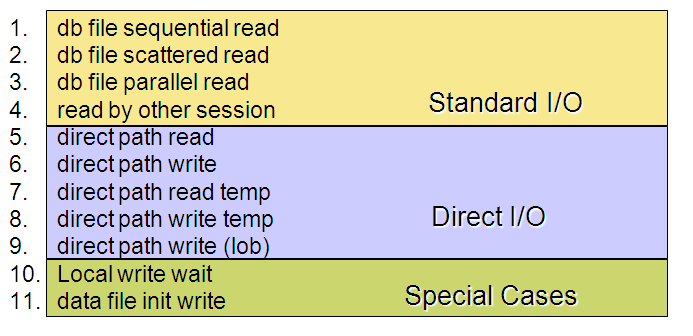
Standard I/O
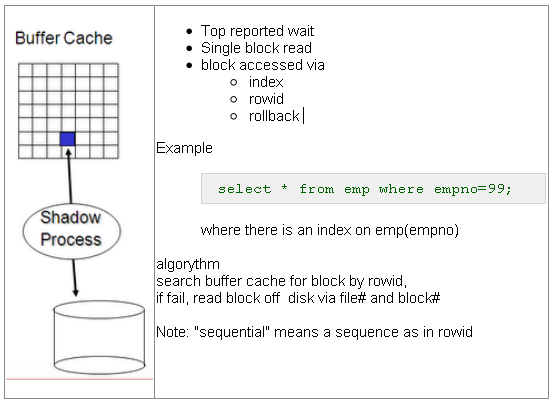
- db file sequential - read Single block read
- db file scattered - read Multi block read
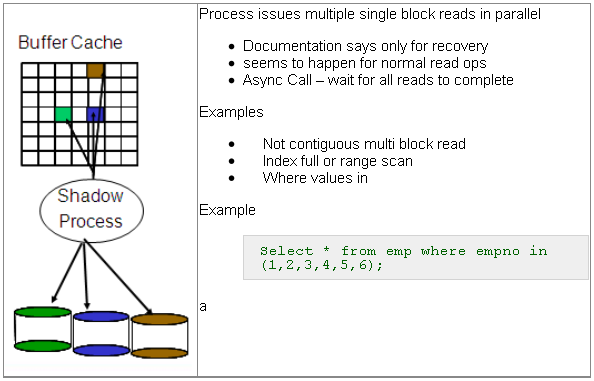
- db file parallel - read Non-contiguous multi block read
- read by other session - wait for another session to do the io
select parameter1, parameter2, parameter3 from v$event_name where ...
   NAME                             P1        P2      P3
   ----------------------- ----------- --------- --------
   db file sequential read       file#    block# blocks
   db file scattered read        file#    block# blocks
   db file parallel read         files    blocks requests
   read by other session         file#    block# class#
db file sequential read
db file scattered read
db file parallel read
read by other session
Direct I/O
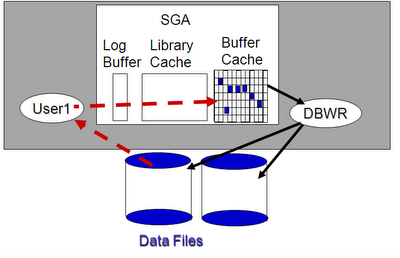
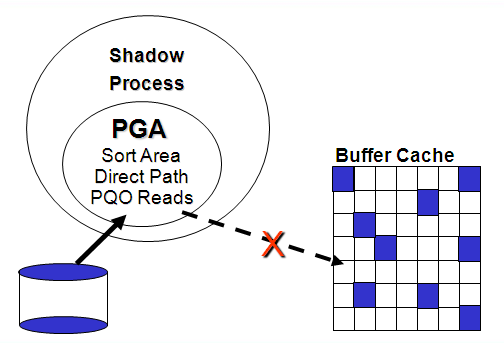
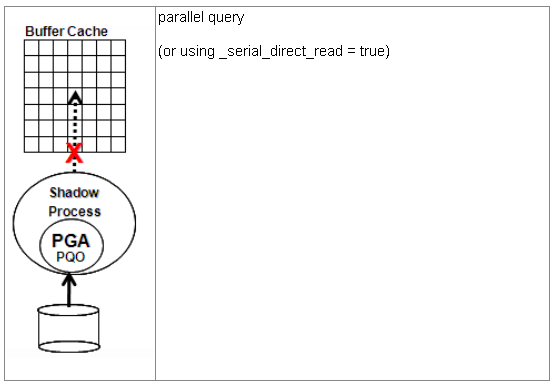
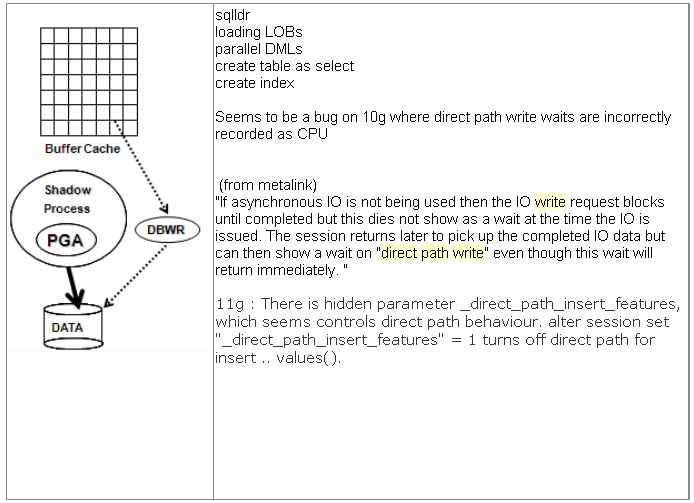
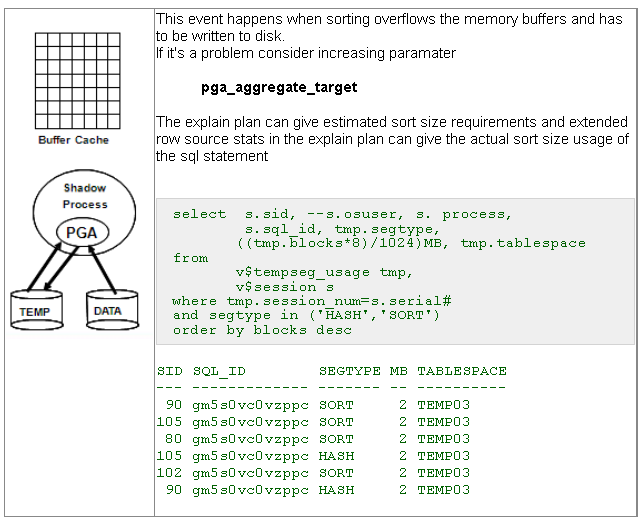
This mechanism lets the client bypass the buffer cache for I/O intensive operations. The disk blocks are written into and read from process private memory.
   select parameter1, parameter2, parameter3 from v$event_name
   NAME                    P1                 P2       P3
   ----------------------- ----------- --------- --------
   direct path read        file number first dba block cnt
   direct path read temp   file number first dba block cnt
   direct path write       file number first dba block cnt
   direct path write temp  file number first dba block cnt
direct path read
Further reading:
direct path write
Further reading:
direct path read temp
direct path write temp
The following information from Jonathan Lewis, Randolf Geist and Joze Senegacnik :
On Oracle starting in 10.2.0.3 to 11.1.0.6, this doesn't work:
- alter session set workarea_size_policy = manual;
- alter session set sort_area_size = 104857600;
- broke in 10.2.0.3
- fixed in 11.1.0.7
Workaround for serial connections, just run the command twice:
- alter session set sort_area_size = 104857600;
- alter session set sort_area_size = 104857600;
But this doesn't work for parallel sessions that don't pick up the manual size at all but use the system default size (64K).You can change the system default, but this will be a one size fits all workaround.
Does not seem to affect HASH_AREA_SIZE. hash_area_size parameter is an integer in bytes so it is might be limited to approx 2G
On 9i the upper limit for sort area size using PGA_AGGREGATE_TARGET for a single session was fixed to 100M unless using undocumented parameters:
- _pga_max_size: Maximum PGA size for a single process
- Defaults to 200M
- _smm_max_size: Maximum workarea size for one process
- Defaults
- Min(0.05*pga_aggregate_target,0.5*_pga_max_size,100M)
- I believe this parameter is in KILOBYTES, from testing, see also comments on
- http://dba-blog.blogspot.com/2005/08/pgamaxsize-hidden-parameter.html
In 10gR2 the 100M does not apply anymore when using a PGA_AGGREGATE_TARGET > 1000M.
In 10.2 it is limited to 200M as long as pga_aggregate_target is smaller than 1GB.
When pga_aggregate_target is large than 1GB then _pga_max_size= 20% of pga_aggregate_target . The pga_aggregate_target now drives in most cases _smm_max_size:
- pga_aggregate_target <=500MB, _smm_max_size = 20%* pga_aggregate_target
- pga_aggregate_target between 500MB and 1000MB, _smm_max_size = 100MB
- pga_aggregate_target >1000MB, _smm_max_size = 10%* pga_aggregate_target
- and _smm_max_size in turns now drives _pga_max_size: _pga_max_size = 2 * _smm_max_size
A pga_aggregate_target larger than 1000MB will now allow much higher default thresholds in 10gR2: pga_aggregate_target set to 5GB will allow an _smm_max_size of 500MB (was 100MB before) and _pga_max_size of 1000MB (was 200MB).
References
- http://jonathanlewis.wordpress.com/2008/11/25/sas-bug/
- http://oracle-randolf.blogspot.com/2008/02/nasty-bug-introduced-with-patch-set.html
- http://kr.forums.oracle.com/forums/thread.jspa?threadID=577711
- http://christianbilien.wordpress.com/2007/05/01/two-useful-hidden-parameters-_smm_max_size-and-_pga_max-size/
- http://www.scribd.com/doc/6884238/SQL-MEMORY-MANAGEMENT-IN-ORACLE-9I
- http://dbakevlar.blogspot.com/2010/01/over-riding-pgaaggregatetarget.html#comments
direct path write (lob)
Special Cases
Analyzing IO
File
- ( sql code -> io by file )
    CNT AAS EVENT                   P1 TABLESPACE
   ---- --- ----------------------- --- ----------
      1 .00 db file sequential read   1 SYSTEM
      2 .00 db file sequential read   3 SYSAUX
     38 .06 db file sequential read   6 SOE
    179 .30 db file sequential read   7 SOEINDEX
Object
- ( sql code -> io by object )
    CNT     AAS OBJN                     OTYPE
   ---- ------- ------------------------- ---------------
     79     .00 52949 ORDER_ITEMS         TABLE PARTITION
     97     .00 -1
    130     .00 53117 ORD_STATUS_IX       INDEX
    498     .01 53120 CUST_EMAIL_IX       INDEX
    512     .01 0
   1632     .03 53112 ITEM_ORDER_IX       INDEX
Object Advanced
- ( sql code -> io by object advanced )
   CNT AAS EVENT           OBJ                P1 TABLESPACE_NAME
   --- --- --------------- ----------------- --- ---------------
     1 .02 db file sequent ORDER_ITEMS_PK      7 SOEINDEX
     1 .02 db file sequent 0                   3 SYSAUX
     2 .03 db file scatter WAIT_OBJECTS        1 SYSTEM
     2 .03 db file sequent ORDER_ITEMS         6 SOE
     3 .05 db file sequent CUST_EMAIL_IX       7 SOEINDEX
     4 .07 db file sequent CUST_LNAME_IX       7 SOEINDEX
     6 .10 db file sequent ORD_ORDER_DATE_IX   7 SOEINDEX
    13 .22 db file sequent ITEM_ORDER_IX       7 SOEINDEX
    25 .42 db file sequent 0                   2 UNDOTBS1
Statement Basic
- ( sql code -> basic statement IO analysis )
   TCNT SQL_ID        CNT AAS  OBJN OBJ             P1 TABLESPAC
   ---- ------------- --- --- ----- --------------- -- ----------
     30 0yas01u2p9ch4   1 .01 53113 ITEM_PRODUCT_IX  7 SOEINDEX
                        1 .01 53079 ORDER_ITEMS_UK   7 SOEINDEX
                       28 .16 53112 ITEM_ORDER_IX    7 SOEINDEX
     58 6v6gm0fd1rgrz   4 .02 54533 WAIT_OBJECTS     1 SYSTEM
                       54 .30     0 0                2 UNDOTBS1
Statement Advanced
- ( sql code -> advance statement IO analysis )
         AAS SQL_ID        PCT OBJ          SUB_OBJ OTYPE      EVENT      F# TABLESPAC CONTENTS
   ---- ----------------- ----------- ------- ---------- ---------- -- --------- ---------
   .00 f9u2k84v884y7  33 CUSTOMERS    SYS_P27 TABLE PART  sequentia  1 SYSTEM    PERMANENT
                      33 ORDER_PK             INDEX       sequentia  4 USERS     PERMANENT
                      33                                  sequentia  2 UNDOTBS1  UNDO
   .01 0tvtamt770hqz 100 TOTO1                TABLE       scattered  7 NO_ASSM   PERMANENT
   .06 75621g9y3xmvd   3 CUSTOMERS    SYS_P36 TABLE PART  sequentia  4 USERS     PERMANENT
                       3 CUSTOMERS    SYS_P25 TABLE PART  sequentia  4 USERS     PERMANENT
                       3 CUSTOMERS    SYS_P22 TABLE PART  sequentia  4 USERS     PERMANENT
                       3 CUSTOMERS    SYS_P29 TABLE PART  sequentia  4 USERS     PERMANENT
                       3 CUSTOMERS    SYS_P21 TABLE PART  sequentia  4 USERS     PERMANENT
                       3 CUSTOMERS    SYS_P35 TABLE PART  sequentia  4 USERS     PERMANENT
                       3 CUSTOMERS    SYS_P32 TABLE PART  sequentia  4 USERS     PERMANENT
                       3 CUSTOMERS    SYS_P27 TABLE PART  sequentia  4 USERS     PERMANENT
                       3 CUSTOMERS    SYS_P34 TABLE PART  sequentia  4 USERS     PERMANENT
                       4 CUSTOMERS    SYS_P23 TABLE PART  sequentia  4 USERS     PERMANENT
                       5 CUSTOMERS    SYS_P33 TABLE PART  sequentia  4 USERS     PERMANENT
                      50 CUSTOMERS_PK        INDEX       sequentia  4 USERS
Missing Object Names
Notice that in some of the analysis the object name or object id is missing? Sometimes the OBJECT ID is -1 or 0 in the ASH data for I/O so the above scripts will be missing the Object Name. In this case there is a second though more costly way to get the OBJECT NAME and that is by using the FILE# and BLOCK# that is being read. The File# and BLOCK# can be translated into to the OBJECT via a query like
   select  segment_name,
               segment_type
   from     dba_extents
   where    &file  = file_id --  File = P1
        and &block between     -- Block = P2
                 block_id and block_id + blocks – 1
This query is expensive and slow. If running this query more than once, it's recommended to create a copy of "DBA_EXTENTS" like
   Create table my_extents as select * from DBA_EXTENTS;
   Create index my_extents_i on my_extents(FILE_ID,BLOCK_ID);
To give an idea of just how much faster a copy of DBA_EXTENTS is, here an example on my machine (with out even creating an index)
   Enter value for file: 3
   Enter value for block: 6619
   OWNER          SEGMENT_NAME          SEGMENT_TYPE
   --------------- -------------------- ------------------
   WMSYS           LOG_TAB_PK           INDEX
   Elapsed: 00:00:41.25
Above I just queried for one block. Now below I will look up over a 150 objects in a faster time !
   create table myextents as select * from dba_extents
   Table created.
   Elapsed: 00:01:25.73
   col own for A7
   col segment_name for a40
   col segment_type for a15
   col cnt for 9999
   Select
         count(*) cnt,
         owner own,
         segment_name ,
         segment_type
   from
         v$active_session_history ash,
         myextents ext
   where
          ( event like 'db file s%' or event like 'direct%' )
       and (current_obj# in (0,-1) or current_obj# is Null)
       and sample_time > sysdate - &v_minutes/(60*24)
       and session_state='WAITING'
       and P1 = file_id
       and P2  between  block_id and block_id + blocks - 1
   group by
      owner, segment_name, segment_type
   /
   CNT  OWN SEGMENT_NAME    SEGMENT_TYPE
   --- ---- ---------------- ------------
     11 SYS SMON_SCN_TO_TIME CLUSTER
    993 SYS _SYSSMU7$        TYPE2 UNDO
   ...
   150 rows selected.
   Elapsed: 00:00:01.03
On other option is querying X$BH just after the IO has occurred. X$BH reveals the contents of which blocks are in the buffer cache, so if the blocks from the recent physical IOs are still in the buffer cache we can query X$BH.
Tuning IO
   Check average read times per file
       Should be between 5-20 ms
           ADDM expects I/Os to be under 20ms
               The parameter defaults to 10000 micro seconds
               change behavior with DBMS_ADVISOR.SET_DEFAULT_TASK_PARAMETER( 'ADDM', 'DBIO_EXPECTED', <new value>)
       Check time in
           Data in Statspack under “File IO Stats” (8i and up)
           DBA_HIST_FILESTATXS for historical (10g)
           V$FILEMETRIC_HISTORY for recent (10g)
   Check Cache buffer Hit ratio
       Check db_cache_advice 9i and higher
       Data in Statspack under “Buffer Pool Advisory”
       Want to optimize data caching
   Tune High IO SQL
       Check reads off of UNDO
Average IO times
Statspack/AWR
   File IO Stats  DB/Inst:labsf03  Snaps: 1-2
                                               Av   Mx                                      Av
                                        Av     Rd   Rd    Av                 Av  Buffer   BufWt
   Tablespace          Filename Reads Reads/s (ms)  Bkt Blks/Rd  Writes Writes/s  Waits    (ms)
   ---------- ----------------- ----- ------- ---- ---- ------- ------- -------- ------- ------
   SYSTEM     /u01/system01.dbf   445      15  0.4   16    1.0    1,157       39   2,744   93.3
   USERS      /u01/users01.dbf    223       7  0.5  ###    1.0    9,725      324       4  100.0
Recent IO read times
   select
          to_char(begin_time,'yyyy-mm-dd hh24:mi') begin_time,
          file_id fid,
          average_read_time *10  avgrd_ms,
          average_write_time *10 avgwr_ms,
          physical_reads pr,
          physical_writes pw
   from
         V$FILEMETRIC_HISTORY f
   order by begin_time;
   BEGIN_TIME        FID AVGRD_MS AVGWR_MS         PR         PW
   ---------------- ---- -------- -------- ---------- ----------
   2008-01-30 12:25    1      5.2      2.5        100         24
   2008-01-30 12:25    5     80.0     20.0          2          2
   2008-01-30 12:25    2     36.7      2.0          3        218
   2008-01-30 12:25    4     22.8      1.8         89       2754
   2008-01-30 12:25    3     22.9      2.6         14         47
Historic IO read times
   select
          to_char(begin_interval_time,'yyyy-mm-dd hh24:mi') snap_time,
          file#,  readtim/nullif(phyrds,0) avg_read_ms, phyrds
   from
        DBA_HIST_FILESTATXS f,
        dba_hist_snapshot  s
   where f.snap_id=s.snap_id ;
   SNAP_TIME          FILE# AVG_READ_MS  PHYRDS
   ---------------- ---------- ----------- ----
   2008-01-05 12:00          9       36.67         39
   2008-01-05 12:00         10       32.31         39
   2008-01-05 13:00          1       11.63     178224
   2008-01-05 13:00          2       56.37       2014
   2008-01-05 13:00          3       17.38      50668
   2008-01-05 13:00          4        9.39     565321
   2008-01-05 13:00          5       38.78         41
   2008-01-05 13:00          6       28.29         41
   2008-01-05 13:00          7       27.44         39
   2008-01-05 13:00          8       42.56         39
   2008-01-05 13:00          9       36.67         39
   2008-01-05 13:00         10       32.31         39
ADDM and Avg Read Times
- The parameter - DBIO_EXPECTED - that tells ADDM what is an acceptable average single block read in micro seconds.
- The parameter defaults to 10000 micro seconds and can be changed with
   exec DBMS_ADVISOR.SET_DEFAULT_TASK_PARAMETER(
                                  'ADDM',
                                  'DBIO_EXPECTED',
                                  <new value>);.
Buffer Cache Hit Ratio
Buffer Cache Hit Ratio (BCHR) has a sordid history and it's tempting to just not mention it. For years the BCHR has been used to identify IO performance bottlenecks despite the fact that it can be completely unreliable. Connor McDonald even wrote a script (http://www.oracledba.co.uk/tips/choose.htm) that allows you to set the BCHR as high as you want without changing the size of the cache. The point being that IO bottlenecks should be identified with IO wait events and not BCHR, but if an IO bottleneck does happen, it is worth knowing if the buffer cache is supporting the IO load sufficiently. The question of whether the Buffer Cache is sufficiently sized can be addressed with Oracle's "DB Cache Advice".
       Buffer Pool Advisory
       Size for   Size      Buffers for   Read      Estimated
       P    Est (M) Factor     Estimate Factor Physical Reads
       --- -------- ------ ------------ ------ --------------
       D         56     .1        6,986    2.3         58,928
       D        112     .2       13,972    1.6         42,043
       D        224     .4       27,944    1.0         25,772
       D        336     .6       41,916    1.0         25,715
       D        448     .8       55,888    1.0         25,715
       D        596    1.0       74,351    1.0         25,715
       D        728    1.2       90,818    1.0         25,715
       D        840    1.4      104,790    1.0         25,715
       D        952    1.6      118,762    1.0         25,715
       D      1,064    1.8      132,734    1.0         25,715
The Buffer Pool Advisory gives expected physical reads at different cache sizes. The column "Factor" shows size relative to the current. I "Factor" of "1" is the current cache size. We can see in the above case, we can actually drop the cache size to .4 of the current size without significantly impacting the physical IO and on the other hand increasing it to 1.8 the current size won't help us at all. In this case the buffer cache size is probably fine an won't help us address IO performance issues on this particular database.
TOP SQL
If the IO response time of the disks is good and if the buffer cache is correctly sized, then at this point it's clear it's time to tune the SQL with the most IO wait time:
   select count(*),sql_id, event
   from v$active_session_history
   where event in ('db file sequential read',
                   'db file scattered read',
                   'db file parallel read')
     and session_state='WAITING'
   group by sql_id, event
   order by count(*);
    COUNT(*) SQL_ID        EVENT
   --------- ------------- ------------------------
          10 8hk7xvhua40va db file sequential read
         335 3hatpjzrqvfn7 db file sequential read
         343 0uuqgjq7k12nf db file sequential read
         549 75621g9y3xmvd db file sequential read
        1311 0bzhqhhj9mpaa db file sequential read
        1523 41zu158rqf4kf db file sequential read
        1757 0yas01u2p9ch4 db file sequential read
IO Considerations
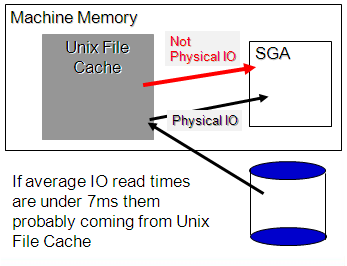
Unix Buffer Cache
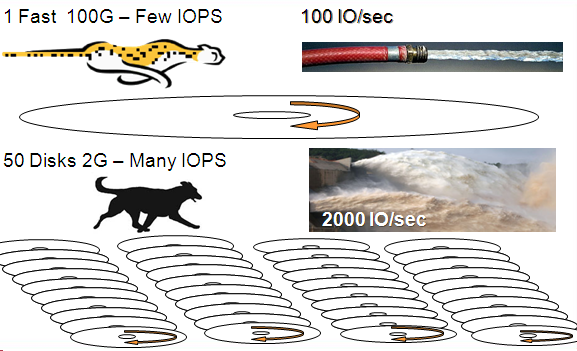
Number of Spindles
Vendors say that read cache will take care of IOPs but of you have a sustained throughput it will only sustain for so long.
Example
| Seagate Barracuda 4LP | Seagate Cheetah 73LP | |
| Capacity | 2.16GB | 73.4GB |
| Rotation Speed | 7200rpm | 10000rpm |
| Rotational Delay(avg) | 4.1ms | 3ms |
| Time to read 32Kb | 6ms | 3ms |
| Seek Time (avg) | 9.4ms | 4.9 |
| Total time for Single I/O | 19.5ms | 10.9ms |
| I/O per second (conservative) | 51 | 92 |
| IOPs/sec per 100GB | 2550 | 126 |
James Morle http://scaleability.com
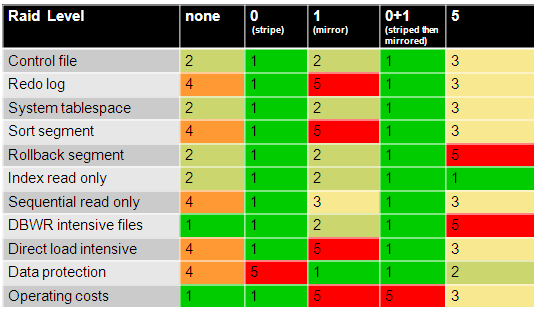
Raid 5
BAARF - Battle Against any Raid Five \http://www.miracleas.com/BAARF/BAARF2.html
In the chart below, 1 represents good and 5 represents bad.
chart from Cary Millsap: http://method-r.com/downloads/doc_details/15-configuring-oracle-server-for-vldb-cary-millsap
Raid 5 runs into performance issues because every write takes two reads plus a write. These two reads can conflict with other readers. Also because Raid 5 is often configured with small stripe sizes, say 32K or 64K, a multiblock read can easily span several disks, increasing the chances of concurrency read conflicts.
SAME - Stripe and Mirror Everything
Oracle's recommendation is to stripe and mirror everything (SAME). See paper http://www.miracleas.com/BAARF/oow2000_same.pdf Redo will take a hit being mixed with everything else, so if it's a possibility, I'd recommend putting redo on a separate stripe/mirror set.
Of course with Oracle's ASM and now Exadata machines, much if this discussion will become mute over the coming years.
