Debugging the Application (IDE Tutorial)
Go Up to Starting your first RAD Studio application Index (IDE Tutorial)
To get a glimpse of the basic debugging features in RAD Studio, set a breakpoint on the first line of the SaveAsActionExecute function by clicking on the bar at the left of the line of code. You can place a breakpoint only on executable lines of code, marked by blue circles ![]() , as seen in the figures below.
, as seen in the figures below.
The Code Editor window should look as follows:
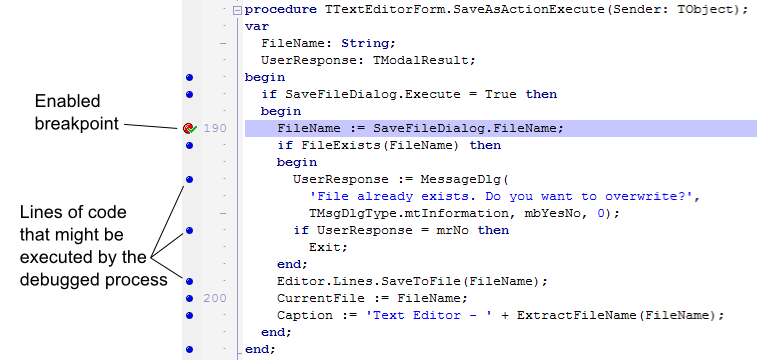
- Debugging the SaveAsActionExecute procedure (Delphi view)

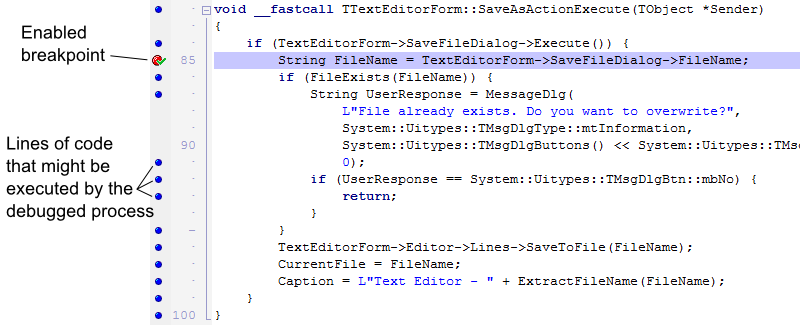
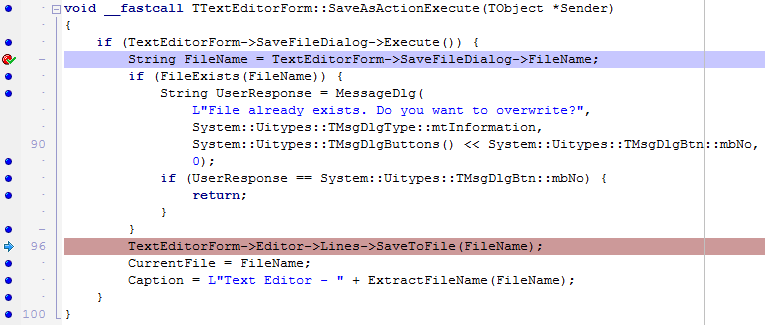
- Debugging the SaveAsActionExecute procedure (C++Builder view)

Press F9 to run your application, type something in the text box of the text editor and click File > Save As. Name the new text file, making sure that a file with the same name
does not already exist in that folder. After clicking Save, your application should stop at the breakpoint you have previously set, and the code editor window should display as follows:

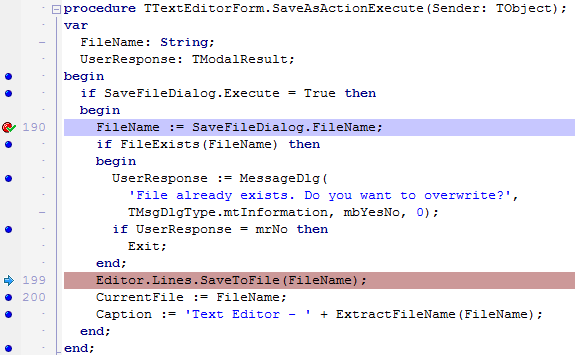
- Application stopping at the specified breakpoint (Delphi view)

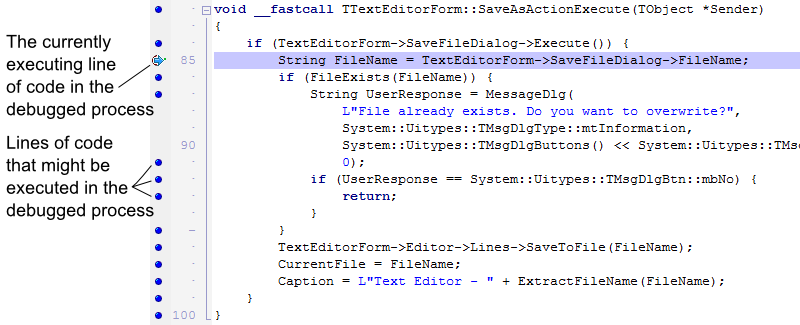
- Application stopping at the specified breakpoint (C++Builder view)

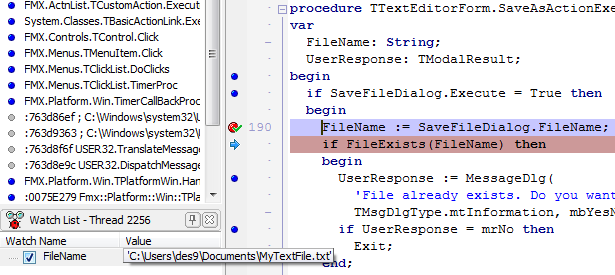
To see the value of the FileName variable, select the FileName word in the first line of SaveAsActionExecute and drag it onto the Watch List:

- Dragging the FileName variable onto the Watch List (Delphi view)

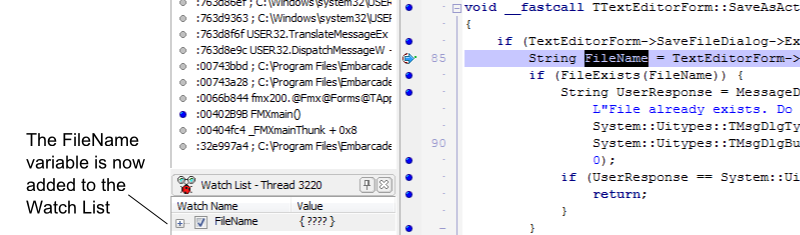
- Dragging the fileName variable onto the Watch List (C++Builder view)

Press F8 to advance to the following line of code, so that the value of FileName is updated. To expand the value of FileName, hover the mouse cursor over its label in the
Watch List:
- Advancing to the next line of code to change the value of FileName (Delphi view)


- Advancing to the next line of code to change the value of FileName (C++Builder view)

Pressing F8 one more time jumps over the if statement, since a file with the given name
does not already exist at the current location:
- Jumping over the if statement (Delphi view)

- Jumping over the if statement (C++Builder view)

Press F8 until you get to the last line of the SaveAsActionExecute function. Now move the mouse cursor over the name of the CurrentFile variable to instantly view its value, as in the following images.
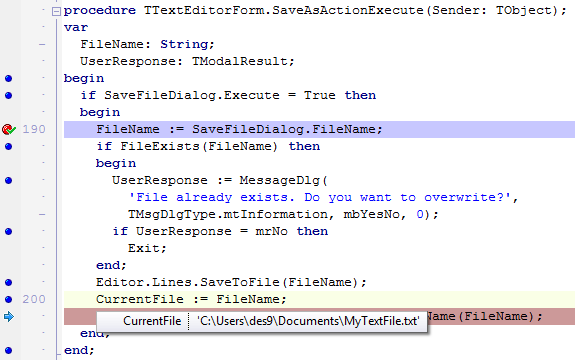
- Viewing the value of CurrentFile (Delphi view)

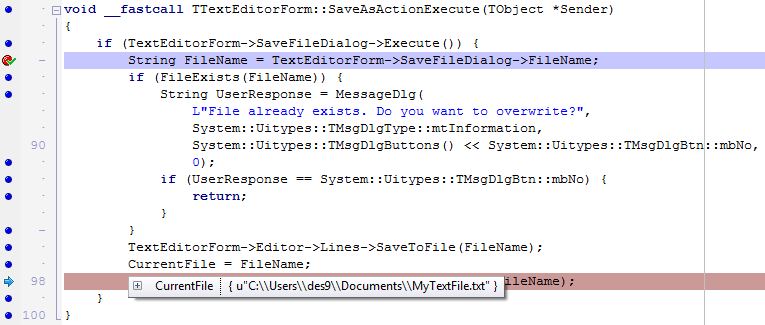
- Viewing the value of CurrentFile (C++Builder view)

To end the debugging session, press the ![]() button on the Debug toolbar:
button on the Debug toolbar:

- The Debug toolbar

Next
See Also
- Overview of Debugging
- Debugging Applications Index - describes numerous debugging procedures
- Debugging Applications
- Debugging Multi-Device Applications