SQL Profiling- Oracle Only
Go Up to Session 9: SQL Debugging and Profiling
The SQL Profiler within Rapid SQL provides the ability to capture the metrics of various PL/SQL programmable objects as they are executed in the database. It quickly identifies performance bottlenecks by first calculating the overall runtimes of objects like Oracle packages, and then computing the amount of time each line of PL/SQL code spends executing. Information is presented in an easily viewed, drill-down format.
- To start a profiling session, use the Tools menu option and select SQL Profiler > Start.
- Enter a name for the profiling session or select an existing name from the dropdown. Press OK. The Profile session is now active.
- Execute the programmable object (i.e. Stored Procedure) you wish to capture metrics on.
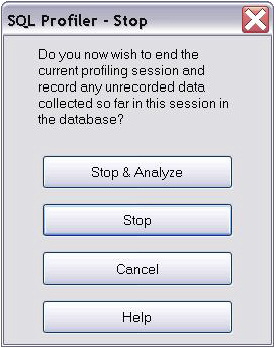
- When finished, select Tools > SQL Profiler > Stop. The SQL Profiler – Stop dialog window prompts you to select an option.
- Press Stop.
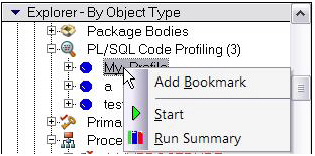
- On the Navigator, expand the PL/SQL Code Profiling node.
- Right-click on the profile session and select Run Summary. The Run Summary window opens.
- Select a session and select Run Detail from the right-click menu. The Run Detail screen appears allowing you to view the metrics for this execution in both a graphical and text format.
- To drill down further into the data, highlight a unit and select Unit Detail from the right-click menu. Scroll through the Source window to view the times for each statement.
- To compare 2 cases, select the 2 cases you wish to compare (shift-click to select the second case) from the Run Summary screen and select Compare from the right-click menu. The SQL Profiler Run Comparison screen appears.
See the relevant online Help topics for more information on profiling.


