Advanced Client-Side Performance Monitoring
Go Up to Session 8: Performance Management
For advanced performance monitoring and management, DBArtisan’s optional Performance Analyst provides intelligent diagnostic information and strong drill-down details to help you get to the heart of any episode of performance degradation. Performance Analyst integrates completely with DBArtisan so that you can fix any performance problems with a few clicks of the mouse.
- Note: Performance Analyst is available for Oracle, SQL Server, Sybase ASE and DB2 for Unix, Windows, and Linux.
- Note: Performance Analyst is a separately-licensed component. If you are not working with an evaluation copy of DBArtisan or do not have a specific license, proceed to Session 10: General Utilities and Tools. Contact your license administrator or your IDERA representative about obtaining a license.
- On the Datasource Explorer, select any Oracle datasource.
- On the Analyst menu, select Performance Analyst. The Performance Analyst opens in the DBArtisan workspace for the target datasource.
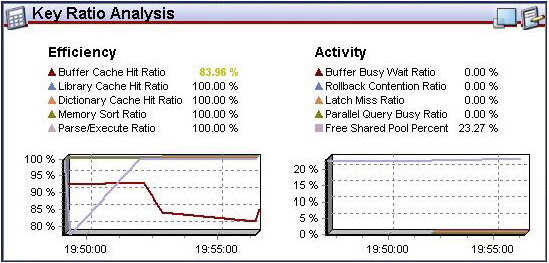
- In addition to the Home page displayed initially, Performance Analyst presents several pages of statistics. Page categories include Memory, I/O, Space, Objects, Users, and OS. Each page contains several panes of related statistics, the Home page’s Key Ratio Analysis pane, for example:
- Note the toolbar at the top of the Performance Analyst. It lets you navigate among the Performance Analyst statistics pages.

- Experiment with displaying the various pages available from the toolbar dropdowns.

See the DBArtisan online help Performance Analyst topics for a detailed walkthrough of all available features and functionality.
Proceed to Session 9: Capacity Management.