ISQL Performance
Go Up to Automated Error Detection and Coding Aid Features
ISQL Performance provides information and statistics about the SQL statements in the SQL editor. While you are writing SQL statements in the SQL Editor, the system is analyzing the query. ISQL Performance generates a report according to the statistics gathered by SQL Server for tables and columns.
Two types of reports are available for each statement:
- Report related to the statement: Report which provides recommendations to the user for improving the system, based on the state of the database and the information gathered from previous queries.
- Report related to the table: Report which provides information like Statistics, Overlapping Statistics, Missing Indexes and Unused Indexes related to the table. This information appears in different tabs of the Performance window.
When any Performance Report is available, the information appears in two different places:
- Error Pane: The Error Pane add a new Performance entry to the list, in case a Performance Report is available. In case the two types of reports are available for the statements, the Error Pane adds two entries to the list.
- Performance Window: Includes a report for Statistics, Overlapping Statistics, Missing Indexes and Unused Indexes in different tabs.
Contents
Enabling ISQL Performance
In order to enable the ISQL Performance feature, you must:
- Go to Tools > Options... > ISQL > Code Assist
- Ensure that Enable performance analysis in ISQL is checked.
For more information, see ISQL Options.
Performance Window
The performance window appears automatically while you are writing in the Code Editor in case a report is available for any of the written SQL statements. Two different types of information may be available for each SQL statement: the Performance Window includes an Statistics tab and a Missing Indexes tab, in case there is any missing index detected.
Performance Window also includes navigation buttons for navigating between reports when performance reports are available for more than one SQL statement.
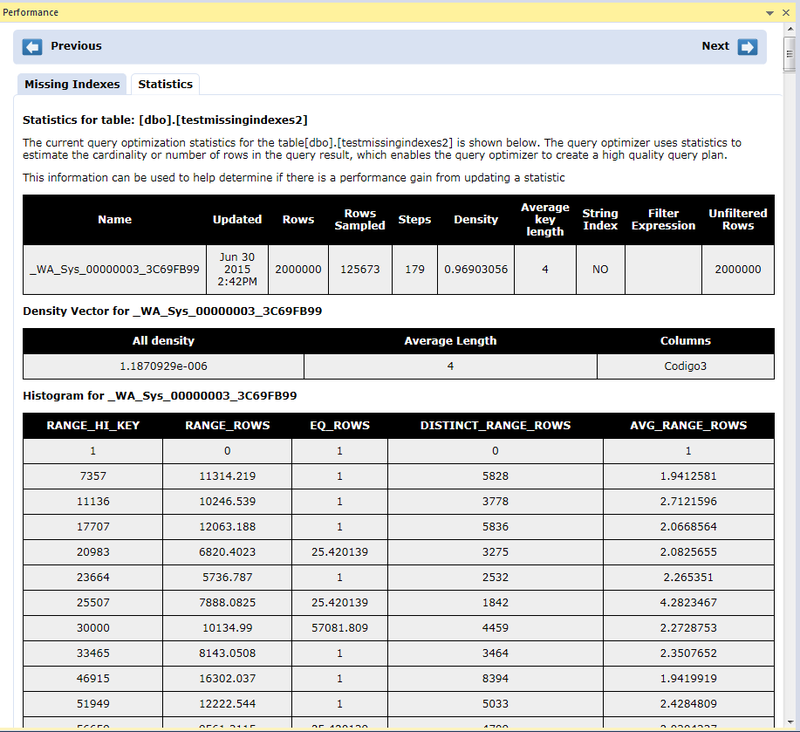
Statistics Tab
The Statistics tab shows the current query optimization for the table in the query. The query optimizer uses statistics to estimate the cardinality or number of rows in the query result, which enables the query optimizer to create a high-quality query plan.
You can use this information to determine if there is a performance gain from updating a statistic.
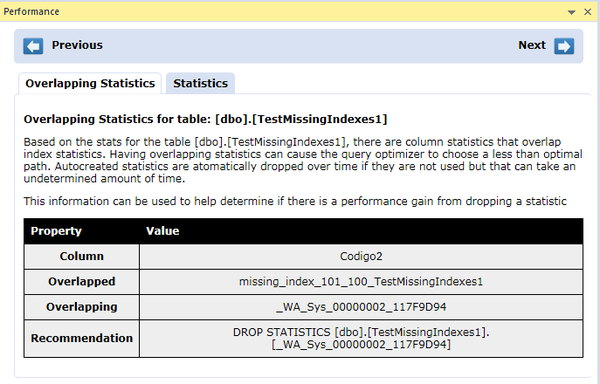
Overlapping Statistics Tab
This tab appears in case there are column statistics that overlap index statistics. Having overlapping statistics can cause the query optimizer to choose a sub-optimal path. Autocreated statistics are automatically dropped over time if they are not used but that can take an undetermined amount of time.
This information helps you determine if there is a performance gain from dropping a statistic.
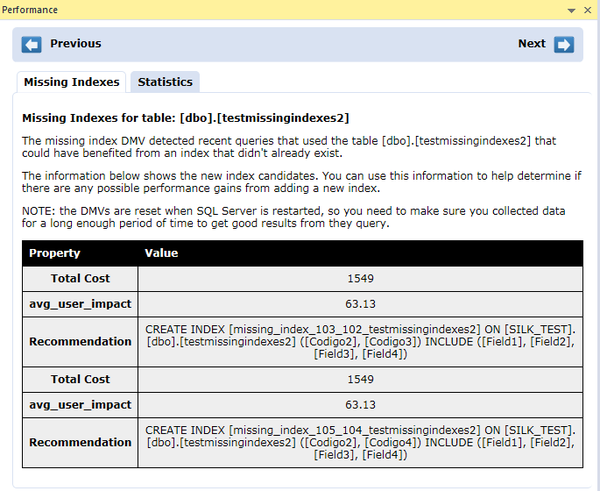
Missing Indexes Tab
This tab appears when recent queries would improve the performance if a new Index was created.
The information in the tab shows the index candidates. You can use the information to determine if there are any possible performance gains from adding a new index.
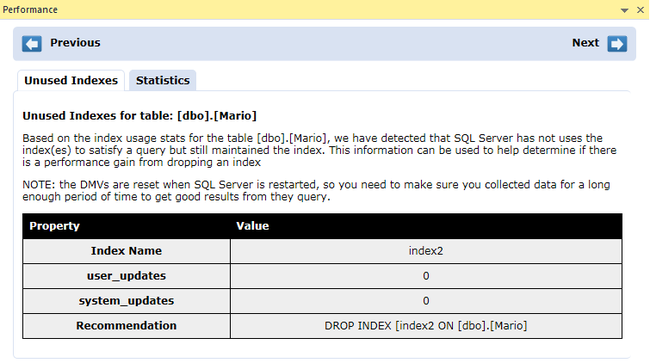
Unused Indexes Tab
This tab appears when there are indexes defined to satisfy a query which are not used. You can use this information to determine if there is a performance gain from dropping an index.
NOTE: the DMVs are reset when SQL Server is restarted, so you need to make sure you collected data for a long enough period of time to get good results from the query.
Recommendations
This tab shows recommendations about the query you are writing in order to improve the performance of the system. Recommendations may be:
- Misuses of
DEALLOCATE - Avoiding "Work tables" when "table variables" can be used.
- Improvements on a SQL statement to improve the performance
- ...
Error Pane
When ISQL Performance creates a new report, it includes an entry in the Error Pane to inform the user about the availability of that new report. As you can see in the next figure, the Error Pane includes a Performance tab where information about the available performance information is indicated.
The Performance tab indicator is green which is also added to the ISQL Editor gutter, indicating which SQL statements have a specific performance report.


