RAD Server Console UI
Go Up to RAD Server Console
You can access the RAD Server Console using your regular browser.
- For a stand-alone application:
http://<ip_address>:<port_number>
- For a Microsoft IIS Server:
http://<ip_address>:<port_number>/<site_name>/emsconsole.dll
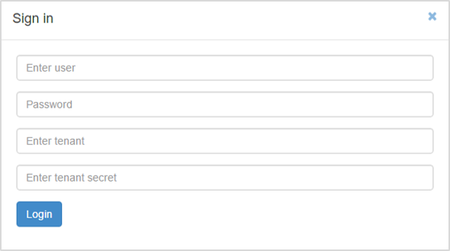
Sign in Page
On the Sign in page, fill in the following fields:
- Enter user: your user name
- Password: your password
- Enter tenant: the name of the tenant which data you want to use
- Enter tenant secret: the secret of the tenant which data you want to use
- Note: If you work in the Single Tenant Mode, you do not need to fill in the Enter tenant and Enter tenant secret fields. As, by default, the system uses the information from the Initial Tenant of your RAD Server.
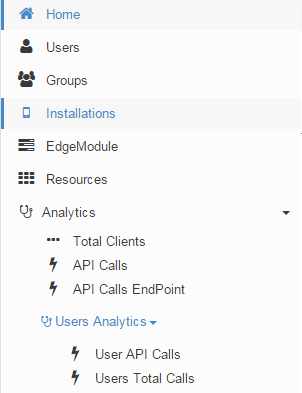
Main Menu
You can access all the pages of the console using the main menu.
Home Page
This page is a summary of the console information that provides the key counters.
- Total Users: Users with activity within the last 90 days. Click this field to redirect to Users Analytics.
- API calls last 24 hours: API calls registered on the RAD Server Engine within the last 24 hours.
- Total Installations: Devices registered in the RAD Server Engine that can receive RAD Server Push Notifications.
- Note: Refresh the page to see the latest statistics.
Users Page
This page shows the Users table. All the columns of the table are displayed by default.
If you hover over the userid field, the list of RAD Server Groups the user belongs to is displayed.
Groups Page
This page shows the Groups table.
If you click in a groupname field, a new table displays the list of RAD Server users that belong to that group.
Installations Page
This page shows the Installations table.
EdgeModule Page
This page shows the modules table.
Resources Page
This page shows the resources table.
Customizing the Appearance of the Tables
On the main menu you have access to the different pages that display table information: Users, Groups, and Installations.
Table functionality:
| Item | Description |
|---|---|
|
Allows filtering the information using a valid JSON object. | |
|
Updates the content of the table with the latest information. | |
|
Hides or shows one or more columns. When a column is hidden, it appears above the table. Click the link to show it again. | |
|
Sorts ascending/descending on any visible column. | |
|
Move a column |
To move and replace a column, place the mouse cursor on the column name, drag the column and drop it on the new location. |
Analytics Summary
Select the analytic you want to display from the drop-down menu. The charts display the information using bars or lines.
Analytics functionality:
| Item | Description |
|---|---|
|
You can export the displayed statistics data to a | |
|
Date Picker |
Allows you to select a different date.
|
|
Refresh |
Updates the charts with the latest information from the database. |
|
Resource drop-down menu |
Select the resource from which you want to display statistics. Select All Resources to view all the information at the same time. |
|
Users drop-down menu |
Select the user name from which you want to display statistics. Use the user filter to quickly find a user in the drop-down list. |
|
Daily / Monthly / Yearly tabs |
Select the appropriate tab to show daily, monthly or yearly information:
|
Below the analytics charts, you can see a list that displays the total number of calls to each RAD Server endpoint method.
Total Clients Page
This chart shows the following:
- Total Users: The total number of users from the RAD Server database.
- Active Users: The users that have connected to the RAD Server Engine API within the last 90 days.
Select the time bases to display the information: daily, monthly or yearly.
API Calls Page
This chart shows the calls to the RAD Server Engine API.
The information is displayed only using bars. Place the mouse on a bar to get the number of different types of calls.
Select the time bases to display the information: daily, monthly or yearly.
API Calls EndPoint Page
This chart shows the calls to the RAD Server Engine API separated by type of call.
From the drop-down menu, select a particular resource to display its statistics data.
Select the time bases to display the information: daily, monthly or yearly.
Users Analytics
This section shows the total number of RAD Server Resource endpoints that a particular RAD Server user or group of RAD Server users call.
User API Calls Page
This chart shows the calls to the RAD Server Resources by a particular RAD Server User.
You can either filter or select a particular RAD Server User from the drop-down menu (that displays all RAD Server Users from the RAD Server database).
From the drop-down menu, select a particular a resource to display its statistics data.
Select the time bases to display the information: daily, monthly or yearly.
User Total Calls Page
This chart shows the total calls make to the RAD Server Server API by a RAD Server User.
The information is displayed only using bars. Each color corresponds to a particular RAD Server User. Place the mouse on a bar to get the number of different types of calls.
From the drop-down menu, select a particular resource to display its statistics data. You can also filter or click a user to add and display its data in the chart, or remove its data from the displayed chart.
Select the time bases to display the information: daily, monthly or yearly.
Using Filters
On the Users, Groups and Installation tables, you can filter the information provided by the console using certain criteria.
- Go to one of the two tables: Users or Groups.
- Click Show search box to open the search box.
- Enter a valid JSON object. For example:
    {"Username": "<name>"} //shows all the users with username = <name>

    {"Username" : {"$like" : "<string>%"}}  //shows all the users with usernames that start with some <string>. It uses % as a wildcard.
- Note: When you start typing, the field shows hints to help you complete the filter. You also have a query sample above the search box.
Exporting Analytics Data
You can export the analytics data displayed in the RAD Server Console. You can see the total amount of calls to the RAD Server Resource endpoints retrieved from the RAD Server database and post-process this information.
The RAD Server data is saved to a .csv file. The format of this file is as follows (depending on the chart that is displayed in that moment):
- Columns correspond to the RAD Server Resource endpoints or the RAD Server Users.
- Rows correspond to the time used to display the information (hours, days or months).


