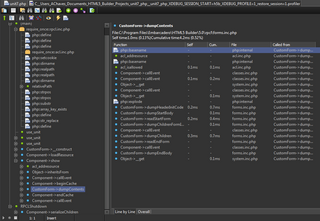
Profiler
The Profiler lets you get a list of the lines of code involved on the generation of a webpage, with information about the processing time each one took, and you can go through the different files called so you can identify bottlenecks in your application.
Usage
To get the performance profile of a page:
- Click
 to enable the profiler.
 - Run your page using
 instead of
  .
. - Click
 to get the profiler results of the last page executed.
