FMXTPlotGrid (Delphi)
Contents
Description
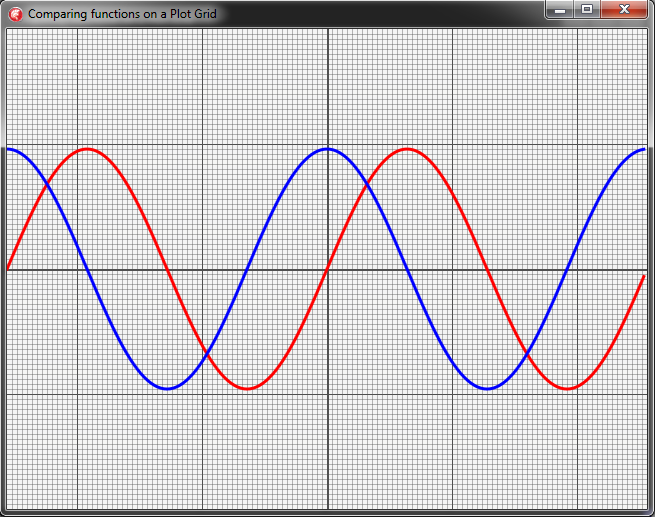
This example shows how to plot functions on a TPlotGrid.
Sine and cosine function graphs are drawn on a TPlotGrid using the DrawPolygon method. This method connects a series of points from a TPolygon.
The thickness and color for each graph are set using the StrokeThickness and Stroke.Color properties of the associated TCanvas object.
xPixels and yPixels keep function values within the grid by scaling them.
Origin is the middle point of the TPlotGrid.
Radian is the angle for which the sine and cosine value sets are calculated. This is increased at each iteration by an Interval.
Resolution affects the number of points in which function values are calculated. A higher value for Resolution means a more precise graph.
To build and test this example, create a Multi-Device Application - Delphi and add a TPlotGrid control to the form. Set the Align property to Client. Create OnPaint and OnResize events for this TPlotGrid.
The OnPaint event will be triggered when the TPlotGrid is painted the first time and whenever Repaint is called.
OnResize will be triggered whenever the TPlotGrid is resized (in this case, when the window is resized). Whenever this event occurs, the grid will be repainted so that the function graphs can be recalculated and scaled accordingly to the new grid size.
Code
unit FMXTPlotGrid;

interface

uses
  FMX.Graphics, FMX.Forms,FMX.ExtCtrls, System.Types, System.UITypes,
  System.Classes, FMX.Types, FMX.Controls, System.Math.Vectors;

type
  TMainForm = class(TForm)
    PlotGrid: TPlotGrid;
    procedure PlotGridPaint(Sender: TObject; Canvas: TCanvas;
      const ARect: TRectF);
    procedure PlotGridResize(Sender: TObject);
  private
    { Private declarations }
    procedure CalculateSin;
    procedure CalculateCos;
    procedure SetParams;
  public
    { Public declarations }
  end;

var
  MainForm: TMainForm;
  FPoints: TPolygon;
  xPixels, yPixels: Double;
  Origin: TPointF;
  Radian, Interval: Double;
  Resolution: Integer;

implementation

{$R *.fmx}


{ TMainForm }

procedure TMainForm.CalculateCos;
var
  I : Integer;
begin
  SetLength(FPoints, Resolution);                       // Alloc space for number of points to be calculated
  SetParams;
  for I := 0 to High(FPoints) do
  begin
    FPoints[I].X := Origin.x + Radian * xPixels / Pi;   // Calculate X value with scaling
    FPoints[I].Y := Origin.y - cos(Radian) * yPixels;   // Calculate Y value (f(X)) with scaling
    Radian := Radian + Interval;                        // Set next point
  end;
end;

procedure TMainForm.SetParams;
begin
  Resolution := 200;                    // Set resolution to 200 points
  Radian := -2.0 * Pi;                  // Start angle at -2Pi
  xPixels := PlotGrid.Width / 4;        // Contain graph width within a quarter of the grid width (actually half because of neg values)
  yPixels := PlotGrid.Height / 4;       // Contain graph height within a quarter of the grid height (actually half because of neg values)
  Origin := PointF(PlotGrid.Width / 2,  // Calculate the center point of the plot grid
    PlotGrid.Height / 2);
  Interval := 4.0 * Pi / Resolution;    // Set interval between two points in which function values are calculated
end;

procedure TMainForm.CalculateSin;
var
  I: Integer;
begin
  SetLength(FPoints, Resolution);                         // Alloc space for number of points to be calculated
  SetParams;
  for I := 0 to High(FPoints) do
  begin
    FPoints[I].X := Origin.x + Radian * xPixels / Pi;     // Calculate X value with scaling
    FPoints[I].Y := Origin.y - sin(Radian) * yPixels;     // Calculate Y value (f(X)) with scaling
    Radian := Radian + Interval;                          // Set next point
  end;
end;

procedure TMainForm.PlotGridPaint(Sender: TObject; Canvas: TCanvas;
  const ARect: TRectF);
begin
  PlotGrid.Canvas.StrokeThickness := 3;                  // Set stroke thickness

  CalculateSin;                                          // Calculate and scale X and sin(X) values and save them in FPoints
  PlotGrid.Canvas.Stroke.Color := TAlphaColorRec.Red;    // Set color for sin to red
  PlotGrid.Canvas.DrawPolygon(FPoints, 1);               // Draw sin graph

  CalculateCos;                                          // Calculate and scale X and cos(X) values and save them in FPoints
  PlotGrid.Canvas.Stroke.Color := TAlphaColorRec.Blue;   // Set color for cos to blue
  PlotGrid.Canvas.DrawPolygon(FPoints, 1);               // Draw cos graph
end;

procedure TMainForm.PlotGridResize(Sender: TObject);
begin
  PlotGrid.Repaint;  // Repaint grid on resize
end;

end.
Uses
- FMX.ExtCtrls.TPlotGrid ( FR | DE | JP )
- FMX.Graphics.TCanvas ( FR | DE | JP )
- System.Math.Vectors.TPolygon ( FR | DE | JP )
- FMX.Graphics.TCanvas.DrawPolygon ( FR | DE | JP )
- FMX.Graphics.TCanvas.StrokeThickness ( FR | DE | JP )
- FMX.Graphics.TBrush.Color ( FR | DE | JP )
- FMX.Controls.TControl.Repaint ( FR | DE | JP )
