Debugging Multi-Device Applications
Go Up to Multi-Device Applications
Contents
- 1 Architecture of Multi-Device Application Debugging
- 2 The RAD Studio Integrated Debugger
- 3 Requirements for Multi-Device Debugging in RAD Studio
- 4 Debugging with C++Builder 64-bit Windows
- 5 Starting the Debugger with a 'Run' Command
- 6 Starting the Debugger with 'Attach to Process' and 'Load Process Remote'
- 7 See Also
Architecture of Multi-Device Application Debugging
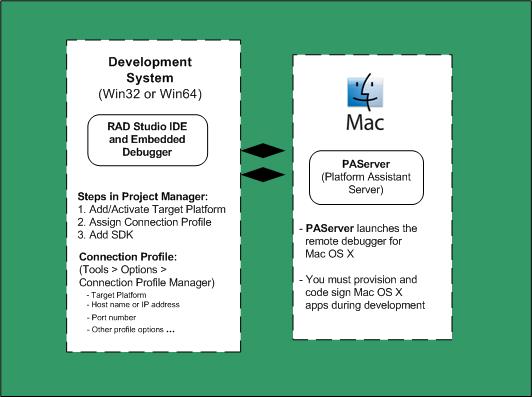
Debugging Mac OS X Applications
On the Mac OS X platform, the debugger needs file permissions. Debugging on Mac OS X is a privileged operation; only a process with adequate access rights can act as a debugger. For more information, see Acquiring Permission to Support Debugging on a Mac.
For details about developing Mac OS X apps, see Mac OS X Application Development.
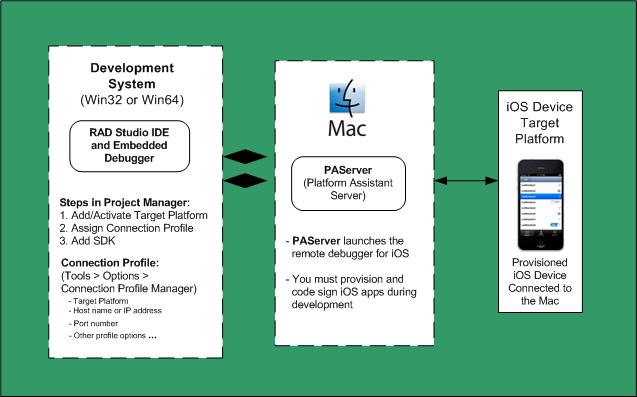
Debugging iOS Apps
- For debugging on the iOS Simulator, iOS Device - 32 bit and the iOS Device - 64 bit target platforms, a few traditional debugger features are not available. For more information, see Debugging iOS Apps.
- For details about iOS app development, see iOS Mobile Application Development.
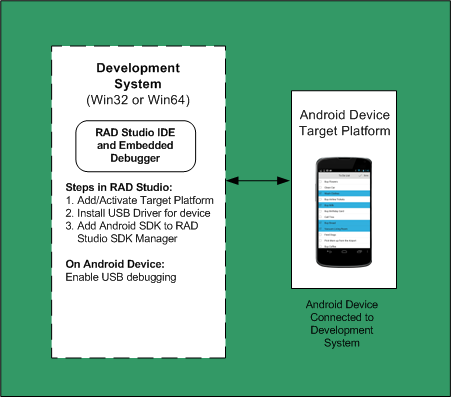
Debugging Android Applications
- For details about developing Android apps, see Android Mobile Application Development.
The RAD Studio Integrated Debugger
The integrated RAD Studio debugger enables you to debug an application that targets any of the Supported Target Platforms. The integrated debugger typically supports both Delphi and C++ applications, except for the C++ 64-bit Windows and Delphi iOS and Android platforms.
RAD Studio supports the following debuggers, all of which run on the specific target platform:
- Embarcadero Win64 Debugger for Delphi (on a PC running a 64-bit Windows OS)
- Embarcadero Win64 Debugger for C++ (on a PC running a 64-bit Windows OS)
- Embarcadero OS X Debugger (on a Mac running a version of OS X)
- Embarcadero iOS Debugger for the iOS Simulator (on a Mac)
- Embarcadero iOS32 Debugger for the 32-bit iOS Device (on a connected 32-bit or 64-bit iOS device)
- Embarcadero iOS64 Debugger for the 64-bit iOS Device (on a connected 64-bit iOS device)
- Embarcadero Android Debugger (on a connected Android device)
The appropriate Embarcadero debuggers are installed when you prepare your development environment as described in the help. For example, when you follow the steps for Mac OS X Application Development, Platform Assistant and the Mac OS X debugger are installed on your Mac. Similarly, when you follow the steps for iOS Mobile Application Development, PAServer and the RAD Studio iOS debugger are installed on your Mac as an intermediate platform that supports your target platform (iOS). The Embarcadero debuggers that are registered on your system are listed in Tools > Options > Debugger Options.
Note: The new debugging solution described in this topic is the recommended solution for multi-device application debugging for Mac OS X, iOS, Android, and 64-bit Windows (from a 32-bit Windows development system). In this scenario, you use the specific multi-device debugger (running on the target platform) along with the integrated debugger in the IDE.
Although the legacy old-style remote debugging solution is still supported, and can optionally be used to install and run the multi-device debuggers, using the old-style remote debugging solution for multi-device applications is not currently documented.
Note about Remote Win32 Debugging: You can optionally continue to use the pre-existing (old-style) remote debugger for all desktop remote debugging. Keep in mind, though, that you will need to manually copy files to the target platform, just as in the past. For instructions on using the old-style remote debugger, see Overview of Remote Debugging and related procedures. The old-style remote debugging solution can be used both for remote Win32 debugging (as before) and for debugging of Win64 and Mac OS X applications. The help, however, does not yet give details about using the old-style remote debugger for multi-device debugging.
Requirements for Multi-Device Debugging in RAD Studio
- For an application running on either a Mac OS X, iOS Device - 32 bit, iOS Device - 64 bit or iOS Simulator target platform, the Platform Assistant and a connection profile are required for establishing a debug session.
- The Android target platform and in-system Win64 target platform do not require either the Platform Assistant or a connection profile.
- For an application running on an Android device, the Android development tools are required; the product installer installs the Android development tools by default.
- Some target platforms require that you add an SDK in the IDE, as described in the next section Requirements for Multi-Device Debugging.
- For example, Android applications require that you add the Android SDK in the IDE. For more information, see SDK Manager.
Typically, both the debugger and the process being debugged run on the target platform. This is true of the iOS Device and the Android Device. But in every case, the debugger reports status and interacts with you on the development PC in the RAD Studio IDE. This means that using one of the multi-device debuggers is very similar to using the integrated debugger for Win32 applications. For common high-level information about debugging, see Overview of Debugging.
To do multi-device debugging:
- Your application must have an activated target platform:
- 64-bit Windows (from a 32-bit Windows development PC)
- Mac OS X
- iOS (Delphi supports either iOS Simulator or the two iOS Device platforms; C++ supports only the two iOS Device platforms)
- Android (Android device)
- Remote 32-bit or 64-bit Windows.
- Depending on the target platform:
- For the Mac OS X and iOS platforms:
- The Platform Assistant must be running on the Mac.
- Your application must be provisioned, code signed, and have an associated connection profile.
- Your development system must have a live connection to the Mac (that is, Test Connection must succeed on the Connection Profile Manager window).
- This connection enables you to use both the integrated debugger and the Deployment Manager.
- In addition, for the two iOS Device platforms, a provisioned iOS device must be connected by USB cable to the Mac.
- Note: You cannot use the integrated debugger to debug an iOS app compiled with either the Ad hoc or Application Store platform configuration.
- For the Android target platform:
- Note: The installer for RAD Studio fulfills these requirements for you by default.
- Install the Android development tools.
- Add an Android SDK to RAD Studio.
- For the 32-bit Windows platform:
- You do not need to use the Platform Assistant because your debug environment is in-machine, and the integrated debugger runs automatically. However, if you wish to remote debug a 32-bit Windows application, you need to set the Include remote debug symbols option in Project > Options > Delphi Compiler > Linking to
True.
- You do not need to use the Platform Assistant because your debug environment is in-machine, and the integrated debugger runs automatically. However, if you wish to remote debug a 32-bit Windows application, you need to set the Include remote debug symbols option in Project > Options > Delphi Compiler > Linking to
- For the 64-bit Windows platform:
- If you are connecting to a remote 64-bit PC:
- You must use the Platform Assistant and a connection profile.
- Your development system must have a live connection to the remote 64-bit PC (that is, Test Connection must succeed on the Connection Profile Manager window). This connection enables you to use both the integrated debugger and the Deployment Manager.
- If your development system is a PC running a 64-bit Windows operating system:
- You do not need to use the Platform Assistant because your debug environment is in-machine, and the integrated debugger runs automatically.
- You can, however, optionally choose to use the Platform Assistant and a connection profile just as you can for a remote 64-bit Windows target system. Doing this enables you to use the Deployment Manager.
- If you are connecting to a remote 64-bit PC:
- An SDK is required (on the SDK Manager) for the following platforms and application types:
- FireMonkey C++ multi-device applications for the Mac OS X platform
- FireMonkey Delphi multi-device applications for the iOS Device - 32 bit and iOS Device - 64 bit platforms
- FireMonkey Delphi multi-device applications for the Android platform
- For the Mac OS X and iOS platforms:
Debugging with C++Builder 64-bit Windows
For C++ 64-bit Windows debugging, a few debugger features are not available.
For more information, see Debugging C++Builder 64-Bit Windows Applications.
Starting the Debugger with a 'Run' Command
When all the Requirements for Multi-Device Debugging are met, entering the Run command does the following:
- Copies the necessary files between the host PC and the target machine specified in the connection profile.
- Runs the application in the appropriate debugger as required for the platform.
For example, if OS X is the active target platform, the executable is copied to the Mac.
You can use any of the standard Run commands to start debugging a multi-device application (for either OS X or Win64):
- Run > Run (F9) (compiles and runs the application in the integrated debugger)
- Run > Step Over (F8)
- Run > Trace Into (F7)
- Run > Run Until Return (Shift+F8)
- Run > Run To Cursor (F4)
- Note: Run to Cursor is not supported for launching the debugger on the Android platform.
Starting the Debugger with 'Attach to Process' and 'Load Process Remote'
To run and debug a compiled binary on a machine running the Platform Assistant server (either a remote PC or a Mac), you can use:
- Attach to Process to debug a running process that is either local or remote. Using the Platform Assistant and a connection profile is recommended here. Some platforms are not supported, as indicated in the Attach to Process dialog box.
- Note: Attachment to a running process is not supported for either the Embarcadero iOS32 Device Debugger, Embarcadero iOS64 Device Debugger or the Embarcadero Android Debugger.
- Load Process Local to load a local debuggee process.
- Note: Load Process Local is not supported for either the Embarcadero iOS32 Device Debugger, Embarcadero iOS64 Device Debugger or the Embarcadero Android Debugger.
- Load Process Remote to load a debuggee process and run it on a remote machine, with some restrictions regarding connection profiles. Some platforms are not supported, as indicated in the Load Process Remote dialog box.
- Note: Load Process Remote is not supported for the Embarcadero Android Debugger.
- Using the Platform Assistant and a connection profile is recommended here.
Timing Issues with Load Process
If you have problems debugging a Mac OS X app that crashes immediately after you run it using Load Process, you should select either the Do not run option or the Run to entry point option (choices under "After load"). Either option can solve the timing issues concerning when the app runs and hits debug events, versus when the debugger is set up and ready to handle the events. These timing issues can cause the debugger to hang.
See Also
- Overview of Debugging
- How to Use the Debugger
- Remote Debugging - Old-Style Procedures
- Creating and Testing a Connection Profile on the Development PC
- PAServer, the Platform Assistant Server Application
- Debugging C++Builder 64-Bit Windows Applications
- Debugging iOS Apps
- Running and Debugging Your Android Application On a Remote Android Device
- Acquiring Permission to Support Debugging on a Mac
- Debugging optimized Win64 code


